
Efficient project management requires precise tracking and analysis of various metrics. Among these, cycle time and lead time are crucial for understanding your team’s performance and improving your workflow. In this article, we’ll explore how to measure cycle time and lead time in Jira or Confluence by using Great Gadgets app.
Cycle Time vs. Lead Time
Before diving further into the article, it’s essential to understand what cycle time and lead time represent:
- Cycle Time: The amount of time it takes for a task to move from the “In Progress” state to “Done”, so the total time from the team’s perspective. It measures the efficiency of the work process.
- Lead Time: The total time taken from when a task is created to when it is completed, so the total time from the customer’s perspective. This includes waiting time and process time, giving a comprehensive view of the task life-cycle.

Tracking these metrics offers several benefits:
- Identify Bottlenecks: Understand where delays occur in your process.
- Improve Efficiency: Optimize workflow by identifying and eliminating inefficiencies.
- Predictability: Provide more accurate delivery timelines to stakeholders.
- Continuous Improvement: Use data-driven insights to enhance team performance.
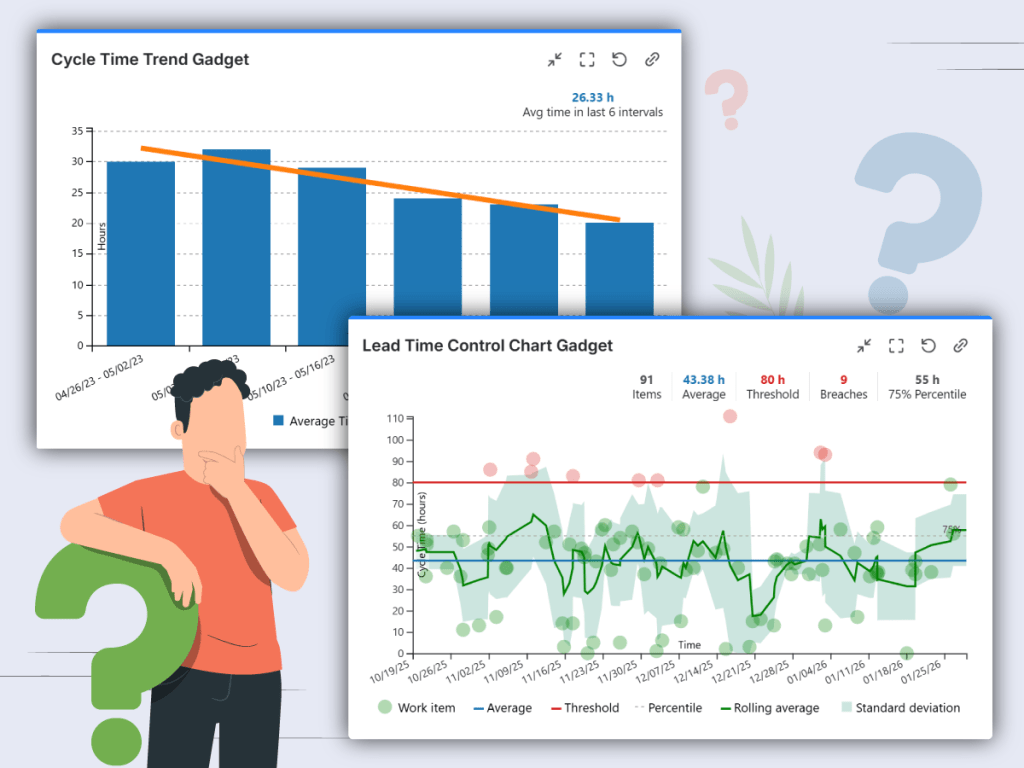
Measuring Cycle Time and Lead Time with Great Gadgets
Mastering key metrics like Cycle Time and Lead Time is essential for optimizing your workflow and ensuring timely delivery. Great Gadgets app provides some powerful gadgets to help you track and visualize Cycle Time and Lead Time directly in your Jira dashboard or Confluence page.
Control Chart Gadget
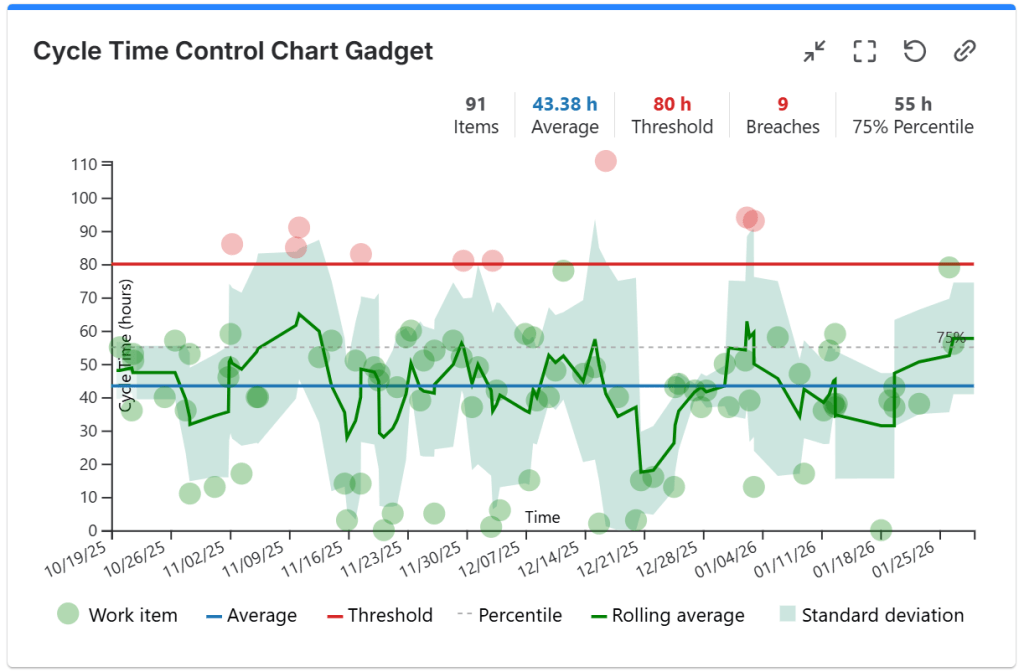
Depending on how you configure it, the Control Chart gadget shows the issues with their cycle time or lead time in a scatter plot chart. It lets you see how long it takes for the team to complete the issues and it helps you easily identify outliers.
You can even set a threshold to identify the issues that took longer than expected. For example, if you set the threshold to the SLA value, what is above the threshold line represents the issues that breached the SLA.
Watch the video on how to display a Control Chart gadget in Jira to see how you can configure the Control Chart gadget to display the Cycle Time or the Lead Time for your projects.
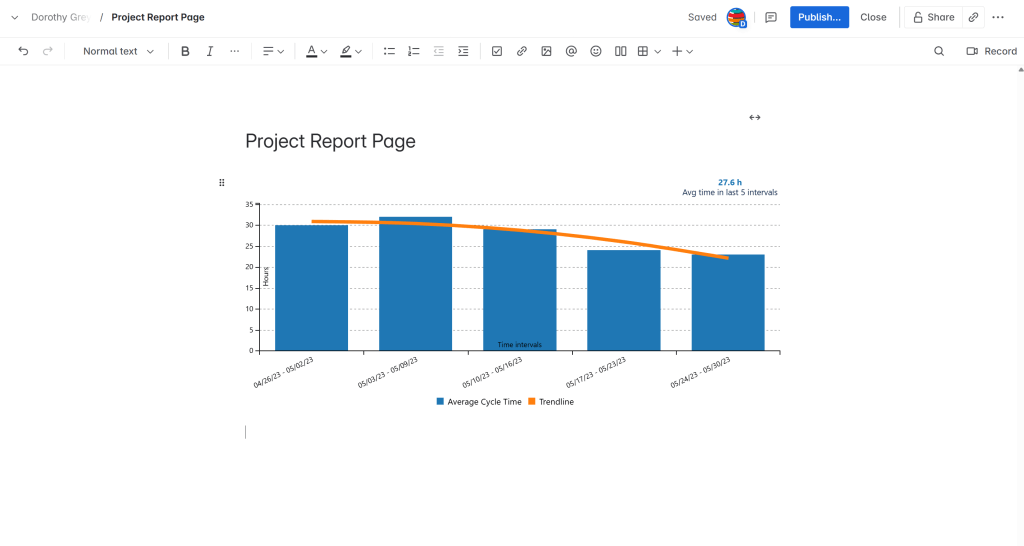
Cycle Time Trend Chart Gadget
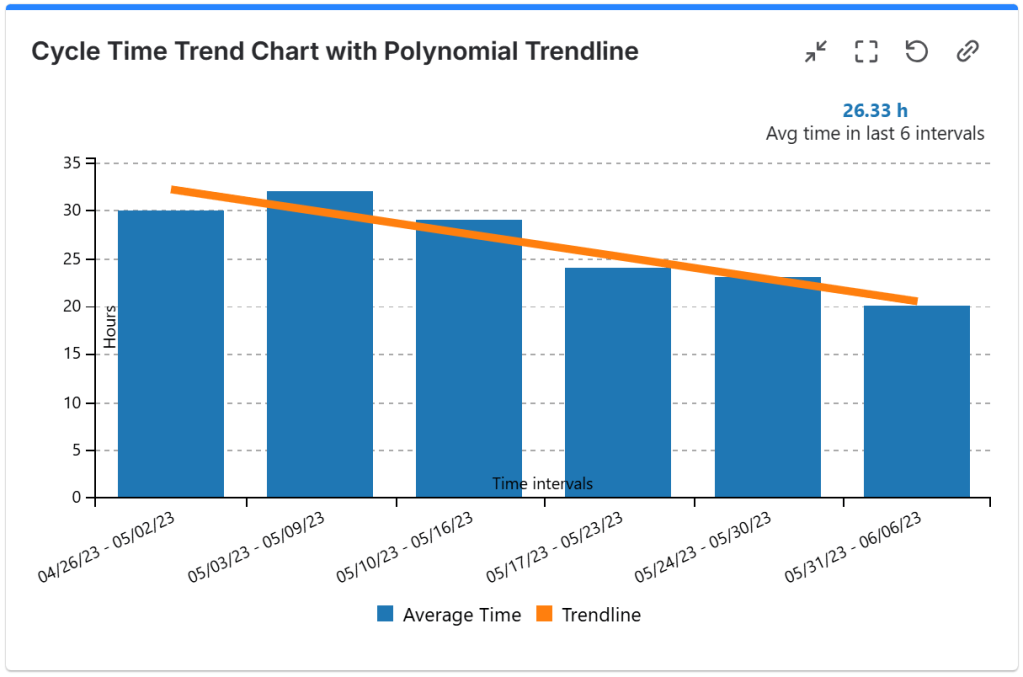
Depending on how you configure it, the Cycle Time Trend Chart gadget calculates your team average Cycle Time or Lead Time for past time intervals and displays their trend. It can also calculate the time between any two Jira statuses from the workflow. The trendline can be displayed as a linear or polynomial line. With this gadget you can see how fast your team is delivering and whether or not the response time has improved over time.
Watch the video on how to display a Cycle Time Trend chart gadget in Jira to see how you can configure the Cycle Time Trend gadget to display the Cycle Time or the Lead Time for your projects.
Histogram Chart Gadget
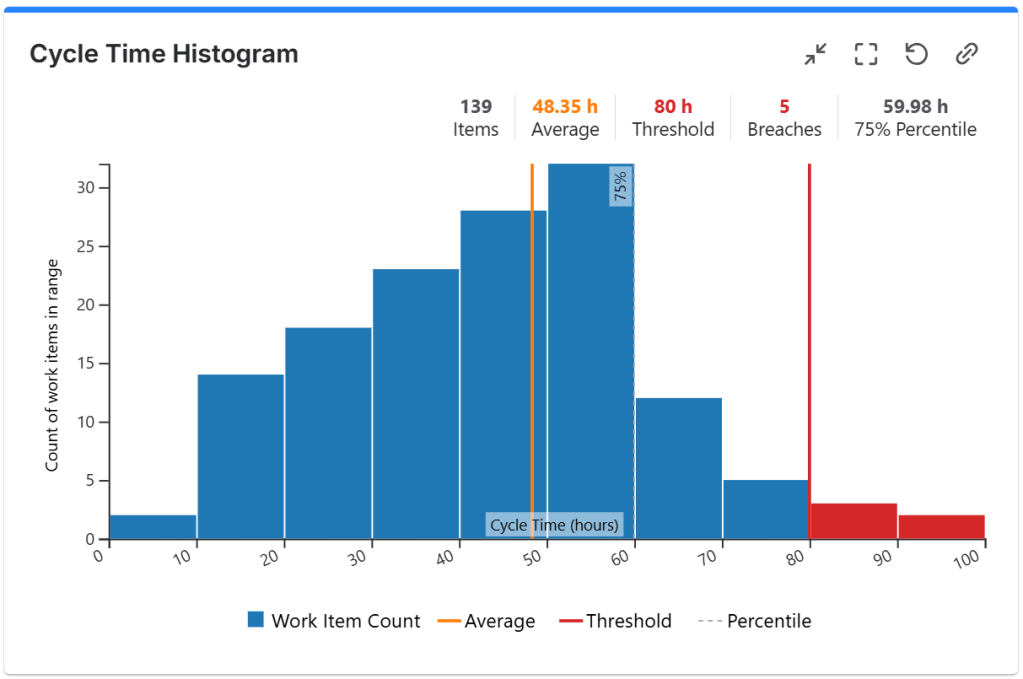
Depending on how you configure it, the Histogram Chart gadget displays the Cycle Time or Lead Time distribution in the form of a bar chart, showing how many issues had cycle/lead time in specific time ranges. It can display an average line and a custom threshold line to easily identify the issues that had an abnormally long cycle time or lead time. With this gadget you can see how fast your team is delivering, how many issues were resolved within the expected timeframe and how many were not.
By setting the threshold to your SLA value, this gadget will tell you how many issues breached the SLA.
Watch the video on how to display a Cycle Time Histogram Chart gadget in Jira to see how you can configure the Histogram Chart gadget to display the distribution of your Cycle Time or Lead Time for your projects.
Measure additional metrics
By using the above gadgets you can measure not only cycle time or lead time; you can measure any segment of the workflow, or ITSM specific metrics like Average Resolution Time (ART) or Average Handle Time (AHT).
Displaying the Cycle Time or Lead Time in Jira
Assuming that you already have Atlassian Jira in place, follow these steps to configure and display any of the 3 gadgets presented above:
- Make sure that you have the latest version of Great Gadgets installed in your Jira instance. If not, you can install the app from the Atlassian Marketplace.
- Add the gadget you want to your Jira Dashboard or Confluence page.
- Configure the gadget to use a board, a filter or a JQL that returns the issues worked on by your team.
- To display Cycle Time: Configure the cycle start to be the entry in an In Progress status and the end of the cycle to be the entry in a Done category status.
- To display Lead Time: Configure the cycle start to When the issue was created status and the end of the cycle to be the entry in a Done category status.
- In the More Settings tab, choose to display the average cycle time and the linear trend line.
- Click Save. The gadget now displays the cycle time for your issues.
Displaying the Cycle Time or Lead Time in Confluence
This gadget can also be used in Confluence. On the Data Center it can be imported as an external macro from Jira, while on the Cloud, you need to install Great Gadgets in your Confluence Cloud instance. The configuration steps are exactly the same.
Conclusion
Measuring cycle time and lead time in Jira or Confluence with the Great Gadgets app is a powerful way to enhance your project management and optimize your workflow. By understanding these key metrics, you can identify bottlenecks, improve efficiency, and deliver better results.
About StonikByte
StonikByte is a Gold Marketplace Partner and the author of various apps (add-ons) for Atlassian Jira, which includes:
- Great Gadgets for Jira – a gadgets pack for tracking projects in an agile manner. Includes gadgets like sprint and release burndown / burnup charts, team velocity, issue field sum-up, cycle time, work breakdown structure (WBS) and more.
- Documents for Jira – a document management system for Jira where you can store and manage your project-related files.
- Project Team for Jira – an app that makes visible the project teams, allows extending the user profiles by adding custom fields, generates and displays org-charts.
- DevOps Gadgets for Jira – an app that brings key development insights from your Bitbucket Cloud and GitHub to your Jira dashboards. It provides essential gadgets to help teams stay on top of their DevOps processes.
To find more about StonikByte, please visit https://stonikbyte.com/.

Leave a comment