-
 Continue reading →: Sprint Carryover in Jira: How to Track and Investigate Unfinished Work
Sprint carryover can make each new sprint harder to plan. Stories waiting for review or testing move into the next sprint alongside new work. A sprint later, some of those same stories are still unfinished. Your team is completing work, so why does this keep happening? Our Velocity vs Throughput…
-
 Continue reading →: Velocity vs Throughput: Choosing the Right Delivery Metric for Your Jira Team
Velocity vs throughput is one of the most common metric comparisons for Jira teams. Both metrics describe delivery, but they answer different questions. Velocity measures how much estimated work a team completes during a sprint. Throughput measures how many work items a team completes during a defined period. Velocity is…
-
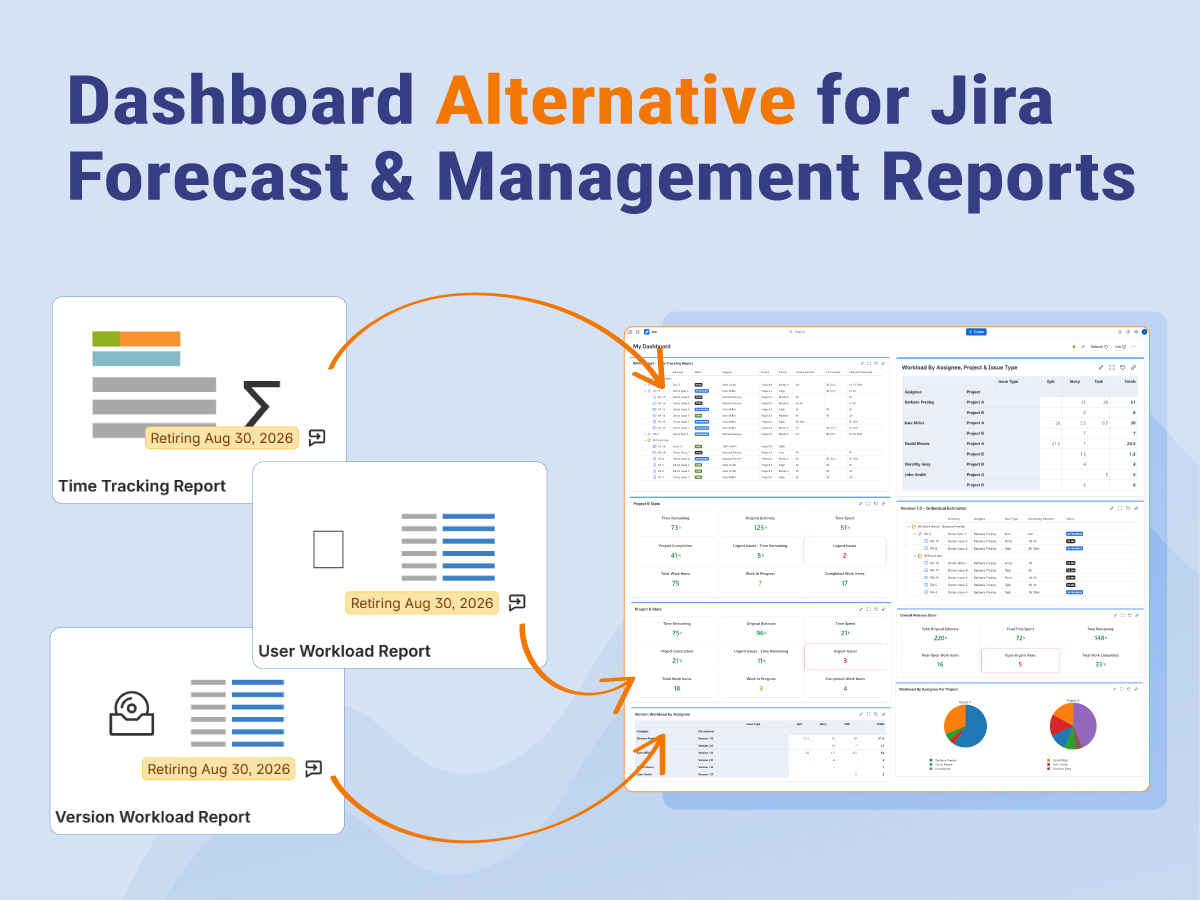 Continue reading →: Jira Is Retiring Time Tracking, User Workload, and Version Workload Reports. What Now?
If you’ve recently opened the Reports section in Jira, you may have noticed that several familiar reports are going to be retired. Among them are the Time Tracking Report, User Workload Report, and Version Workload Report. These reports have been part of many teams’ daily workflows for years. They helped…
-
 Continue reading →: Executive Reporting in Jira or Confluence: How to Give Leaders the Clarity They Actually Need
If you use Jira every day, you already know how powerful it is for tracking work. But when it comes to executive reporting, things often get tricky. Jira is built for teams, not for boardroom conversations. When executives ask for a project status update, they are not looking for raw…
-
 Continue reading →: How to Track Time in Jira and Build Worklog Reports in Dashboards (Without Exporting to Excel)
If you’ve ever exported data from Jira into spreadsheets just to create worklog reports, you already know how tedious it can get. You download a CSV file, clean up the data, build a pivot table, and then repeat the same process next week. It works, but it’s slow and often…
-
 Continue reading →: How to Build Dynamic Reports in Jira and Confluence Using Pivot Tables and Pivot Charts
Pivot Tables in Jira: Real-Time Reporting for Every Team When managing projects, having clear visibility over your data is essential. Whether you need to analyze progress, monitor team performance, or present results to stakeholders, raw issue lists and default reports often fall short. If you’ve ever managed a project in…
-
 Continue reading →: Time In Status: How to See How Long Issues Stay in Each Status in Jira
Understanding time in status (how long issues spend in each workflow status) is essential for any team — Agile or not. However, if you’ve tried tracking this in Jira, you’ve likely run into a problem. Native options feel limited. They are also hard to customize. As a result, they rarely…
-
 Continue reading →: Great Gadgets vs Jira Reports: How Great Gadgets Elevates Software Development Reporting
Effective reporting is critical for project success. Whether you’re using Scrum, Kanban, or scaling Agile across multiple teams with frameworks like SAFe®, you need clear, real-time visibility. Otherwise, decisions become guesswork. That’s where tools like Great Gadgets come in. They help teams turn Jira data into meaningful, easy-to-understand insights that…
-
 Continue reading →: How to Display Linked Issues and Their Status in Jira Dashboards by using Great Gadgets app
When you’re managing work in Jira, linked issues play a key role in understanding dependencies, blockers and how tasks impact one another. But there’s one big limitation teams run into immediately: 👉 There is no build-in way in Jira to show linked issues together with their statuses. You can open…
-
 Continue reading →: Sprint Burndown with Subtasks: How to Create Accurate Sprint Reports in Jira
In this article, you’ll learn how to create a Sprint Burndown with subtasks (or Burnup chart) using Great Gadgets app for Jira or Confluence. No more Excel exports, no manual tracking – just a clear, real-time view of your sprint progress with subtasks included. The Challenge: Jira’s Native Burndown Chart…

Follow us
Subscribe
Stay updated with our latest news by joining our newsletter.
Recent posts
Tags
agile (26) Customer Satisfaction (CSAT) (1) Customer Sentiment (1) cycle-time (1) DevOps Gadgets (1) DMS (1) Documents for Jira (1) Epics (1) great-gadgets (24) IT Service Management (2) jira (9) jira-service-management (2) Jira Dashboards (5) Jira Service Management (3) kanban (3) lead-time (1) SAFe (1) scaled-agile (2) scrum (3) time-tracking (1)
Designed with WordPress