Do you have a large release that spreads across multiple projects or multiple teams and you don’t have a good way for tracking it and for making a picture about the overall progress?
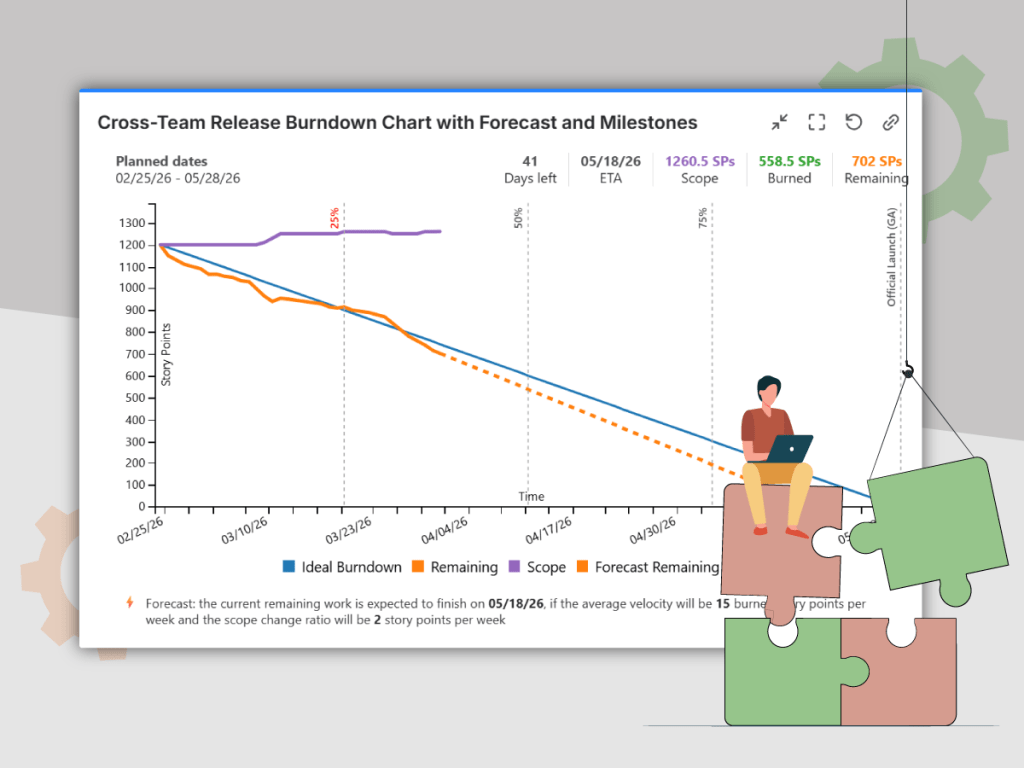
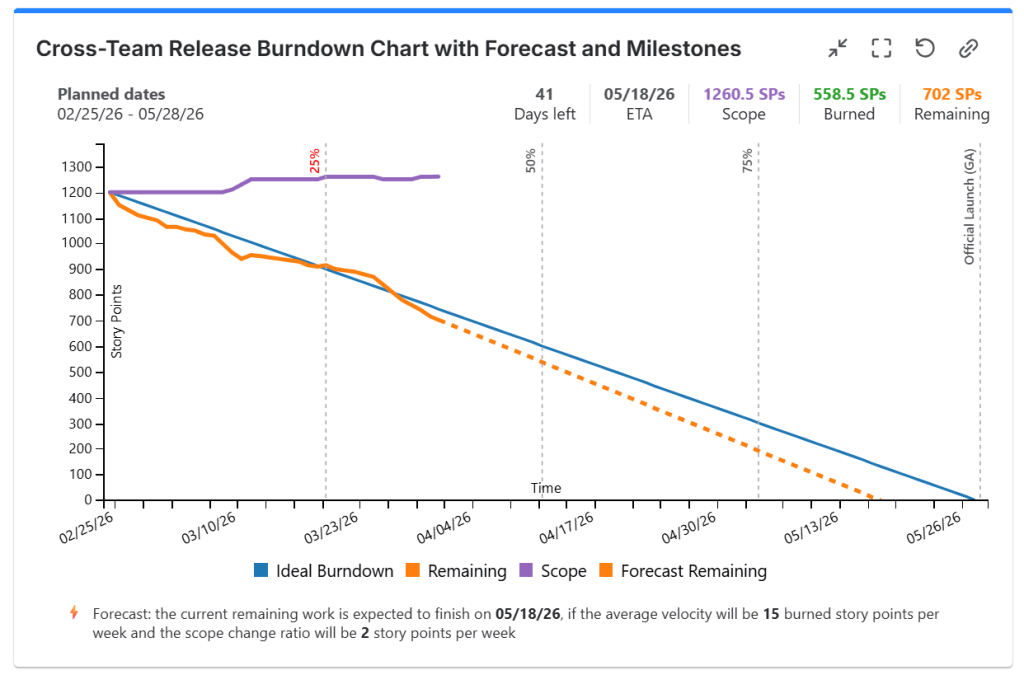
With Great Gadgets app for Jira you can solve this quickly. This app offers a Release Burndown/Burnup Chart dashboard gadget that you can use to generate a cross-project or cross-team release burndown/burnup in a few steps. The gadget uses the work items from a specified Jira filter as project scope and allows you to specify the release start / end dates. You can choose to display the chart by story points, work item count, original time estimate or by any other numerical custom field defined in your Jira instance and you can also include the sub-tasks in the calculation. Optionally, you can choose to display a forecast line that predicts the release ETA.
Assuming that you already have Atlassian Jira in-place, follow these steps to configure and display the Release Burnup Burndown Chart gadget:
- Make sure that you have the latest version of Great Gadgets installed in your Jira instance. If not, you can install the app from Atlassian Marketplace.
- Create a new filter in Jira (or use an existing one) that includes the Jira work items (tasks, stories, defects, etc) from all the projects/teams that you want to track. Make sure to include the sub-tasks in this filter if you want the gadget to also consider the sub-tasks. Share this filter with your project members or the people that are going to visualize the chart.
- Decide on which Jira dashboard you want to add the Release Burnup Burndown Chart gadget. Create a new Jira dashboard or choose an existing one.
- Add the Release Burnup Burndown Chart gadget to your Jira dashboard.
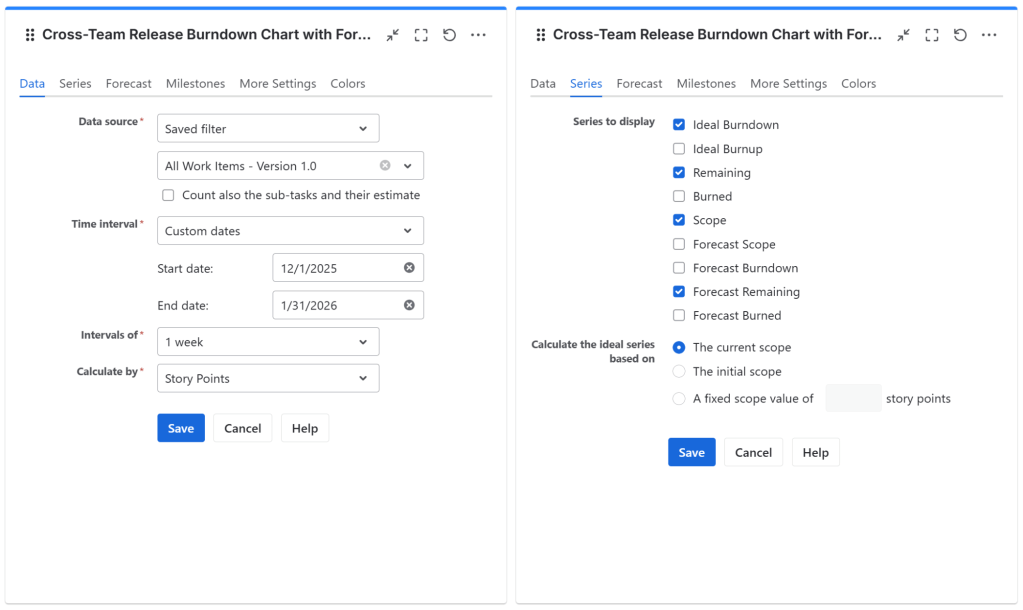
- Configure the gadget. At Data source, enter the filter that you created before. As you can see, the Intervals of length is configurable and you can choose to calculate by Story Points, Work Item Count, Original Time Estimate or by any other numerical custom field.
- In the Series tab, select which series (lines) to be displayed in the chart.
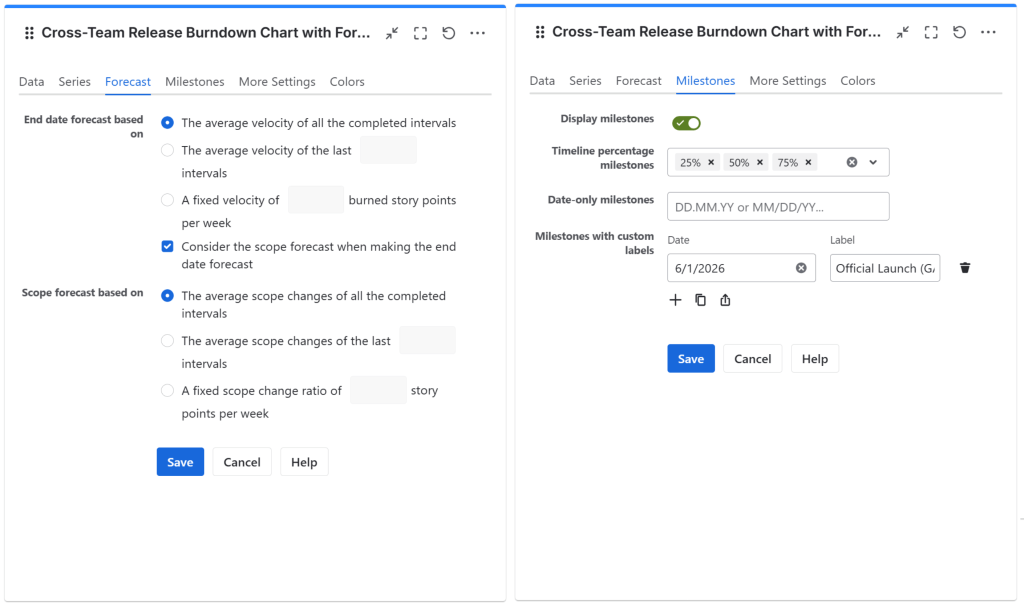
- In case you selected a forecast line, in the Forecast tab, select the velocity calculation method at End date forecast based on.
That’s all! Click Save. The gadget now displays the cross-projects or cross-teams burndown/burnup chart on your Jira Dashboard.
Watch this video to learn more about how you can configure the Release Burndown Burnup Chart Gadget.
If you have further questions or suggestions, don’t hesitate to contact support@stonikbyte.com.
About StonikByte
StonikByte is a Gold Marketplace Partner and the author of various apps (add-ons) for Atlassian Jira, which includes:
- Great Gadgets for Jira – a gadgets pack for tracking projects in an agile manner. Includes gadgets like sprint and release burndown / burnup charts, team velocity, issue field sum-up, cycle time, work breakdown structure (WBS) and more.
- Documents for Jira – a document management system for Jira where you can store and manage your project-related files.
- Project Team for Jira – an app that makes visible the project teams, allows extending the user profiles by adding custom fields, generates and displays org-charts.
- DevOps Gadgets for Jira – an app that brings key development insights from your Bitbucket Cloud and GitHub to your Jira dashboards. It provides essential gadgets to help teams stay on top of their DevOps processes.
To find more about StonikByte, please visit https://stonikbyte.com/.

Leave a comment