-
 Continue reading →: How to display the progress of Epics, Initiatives and Themes in Jira or Confluence with Great Gadgets
Managing large projects often requires a higher level of organization, and Epics play a crucial role in structuring that. Keeping track of Epic progress is essential for ensuring that your team stays aligned and meets project goals. We’ll explore in this blog post why tracking Epics is important and how…
-
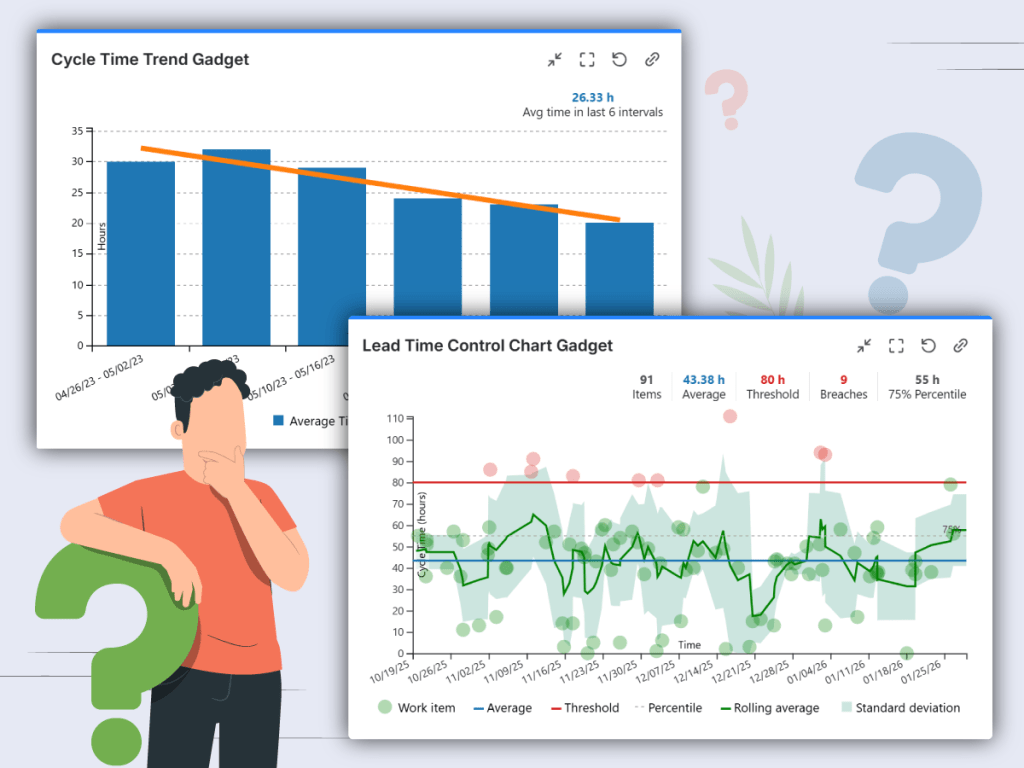 Continue reading →: How to measure Cycle Time and Lead Time in Jira or Confluence with Great Gadgets app
Efficient project management requires precise tracking and analysis of various metrics. Among these, cycle time and lead time are crucial for understanding your team’s performance and improving your workflow. In this article, we’ll explore how to measure cycle time and lead time in Jira or Confluence by using Great Gadgets…
-
 Continue reading →: How to measure customer satisfaction in Jira or Confluence with Great Gadgets app
In IT Service Management (ITSM), Average Customer Satisfaction (CSAT) is a key metric that directly impacts service improvement strategies and overall business success. It measures how satisfied customers are with the services provided, offering insights into areas needing improvement and highlighting successes. High customer satisfaction often correlates with improved customer…
-
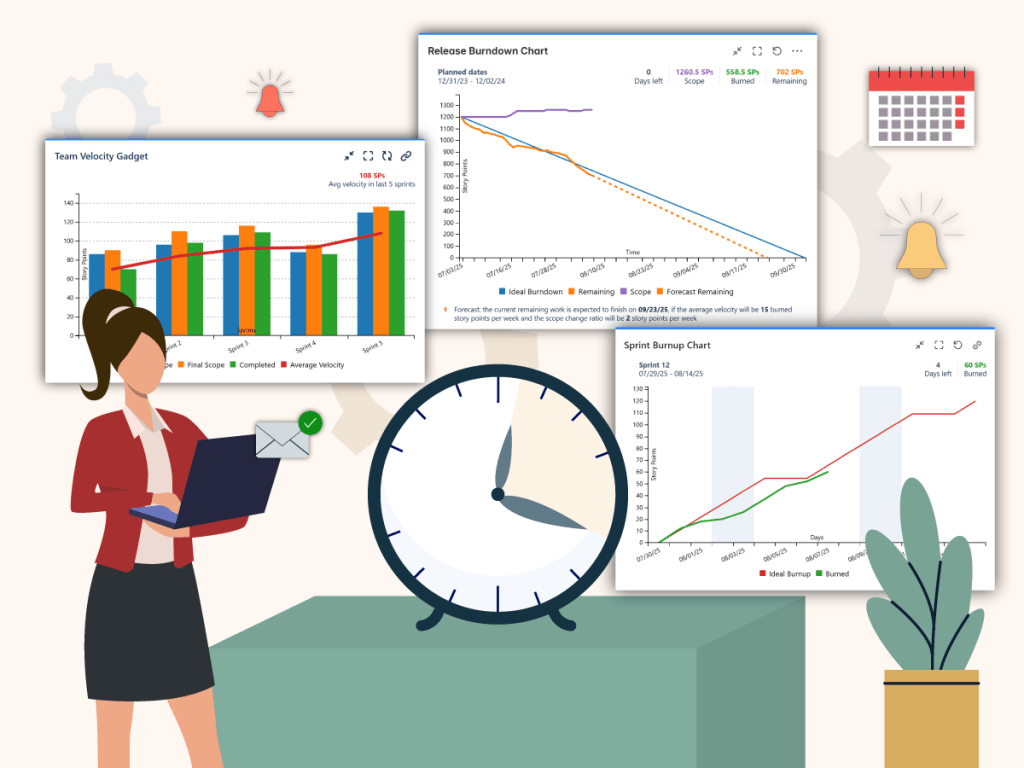
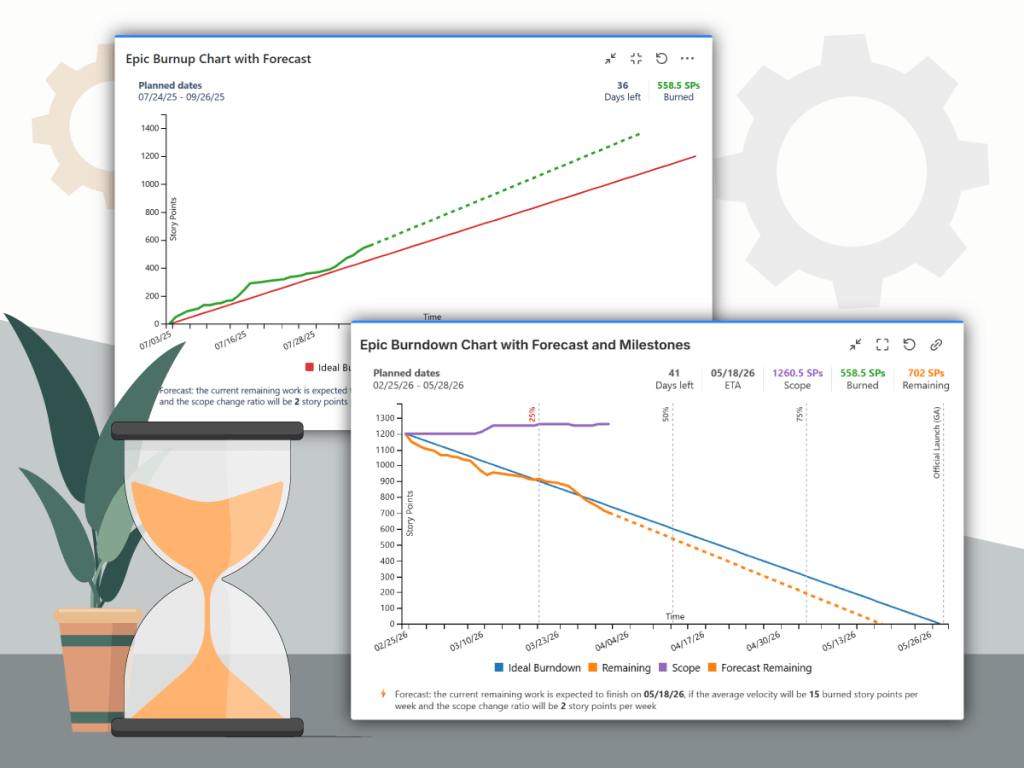 Continue reading →: How to create an epic burndown or burnup chart in Jira and Confluence with Great Gadgets app
A key component of agile project tracking is the burndown chart, a visual representation of the work remaining versus time and the planned work. A burndown chart provides a real-time visualization of progress, helping to identify potential bottlenecks and ensuring that the team remains on track to meet its project…
-
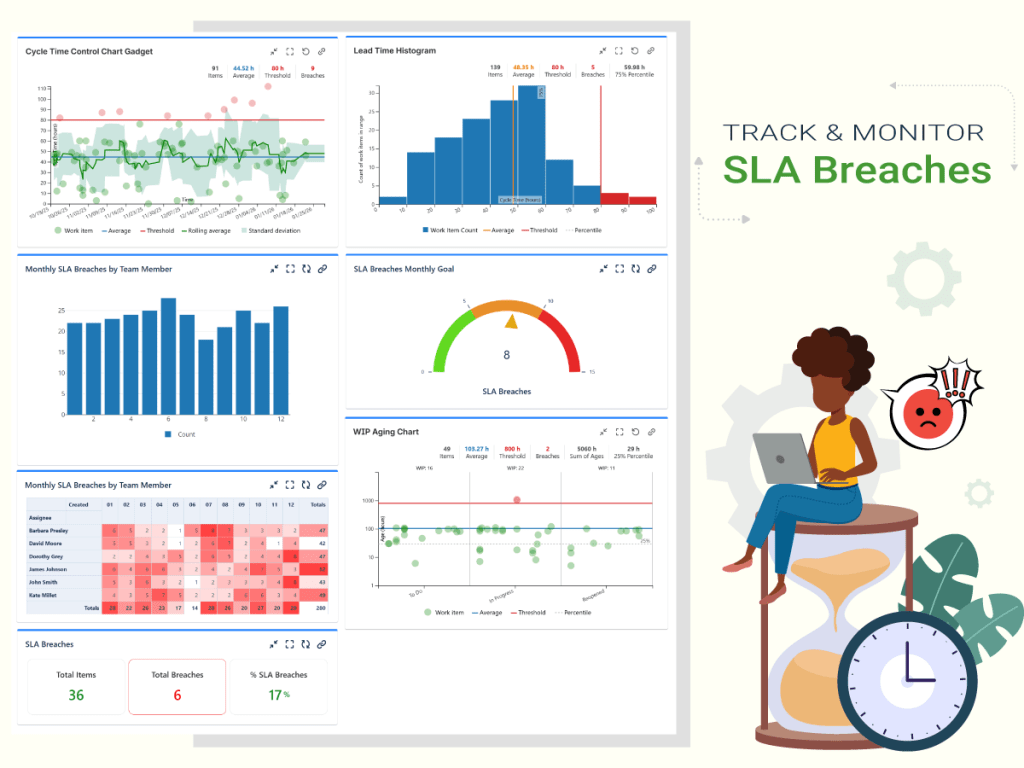
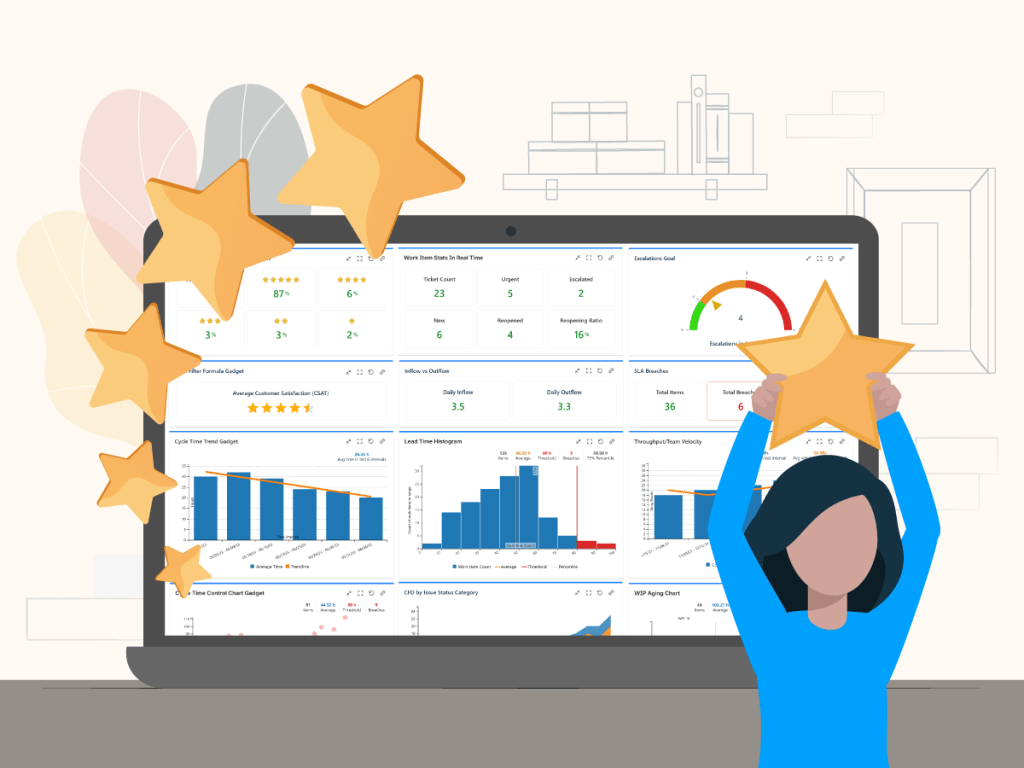 Continue reading →: An effective dashboard for Service Desk and Customer Support teams in Jira Service Management
IT service management, often referred to as ITSM, is simply how IT teams manage the end-to-end delivery of IT services to customers. The incident management and problem management are core ITSM processes in every organization that offers services to their customers. Having a high-performing Customer Support Team that handles issue…
-
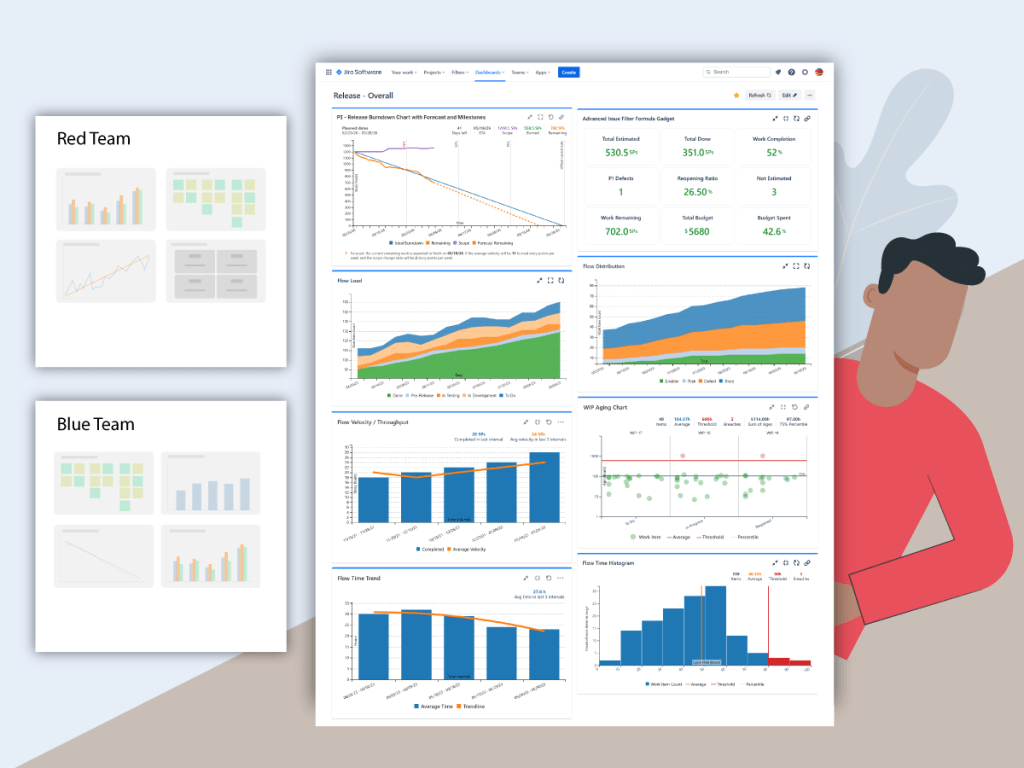 Continue reading →: How to track multi-team or scaled-agile projects (such as SAFe®) in Jira with Great Gadgets app
It is well known that project monitoring is a key-factor for the success of every project. It involves tracking the project metrics, progress, and associated tasks to ensure everything is completed on time, on budget, and according to project requirements and standards. Project monitoring also includes recognizing and identifying roadblocks…
-
 Continue reading →: Tracking an agile project that uses time estimates with Great Gadgets for Jira
Not all the agile projects use Story Points for estimating the backlog items, like stories or tasks. Some projects use time estimates (work hours or work days) while some others also track the time spent on every backlog item or sub-task on a daily basis. Tracking such project that uses…
-
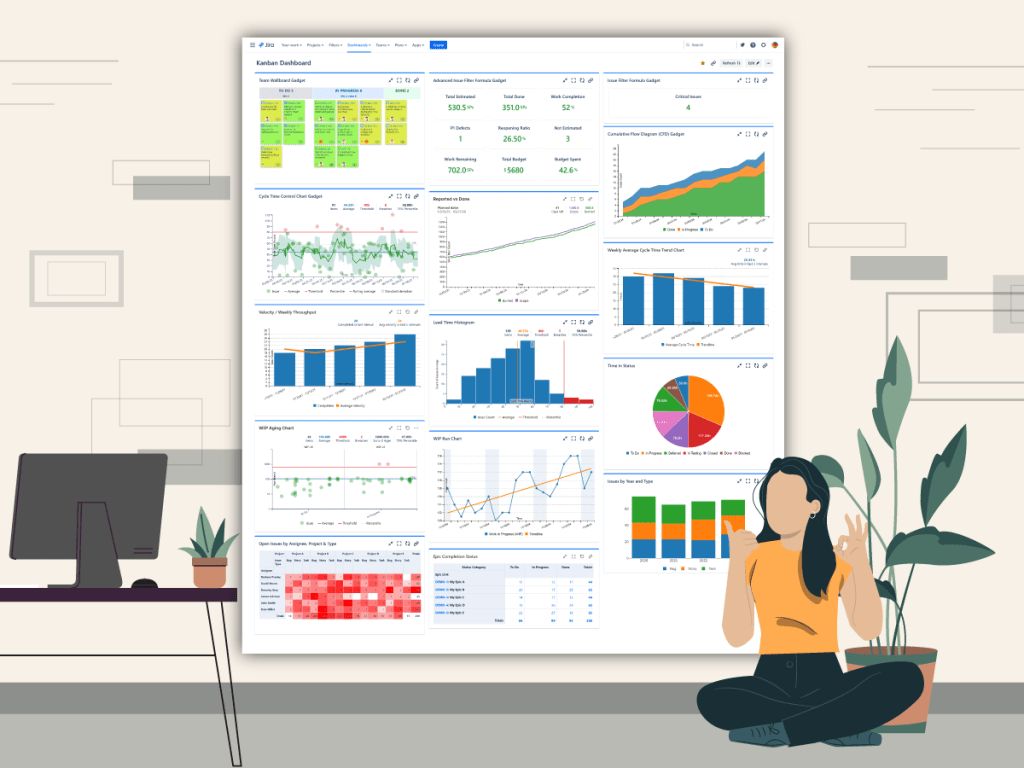 Continue reading →: 13 “must-have” gadgets for any Kanban dashboard in Jira
Kanban is a popular agile framework suitable for both operations and development teams. It does not matter if you are a support team handling issues reported by customers, an internal service desk team or a company that delivers pizza, Kanban helps you visualize both the process (the workflow) and the…
-
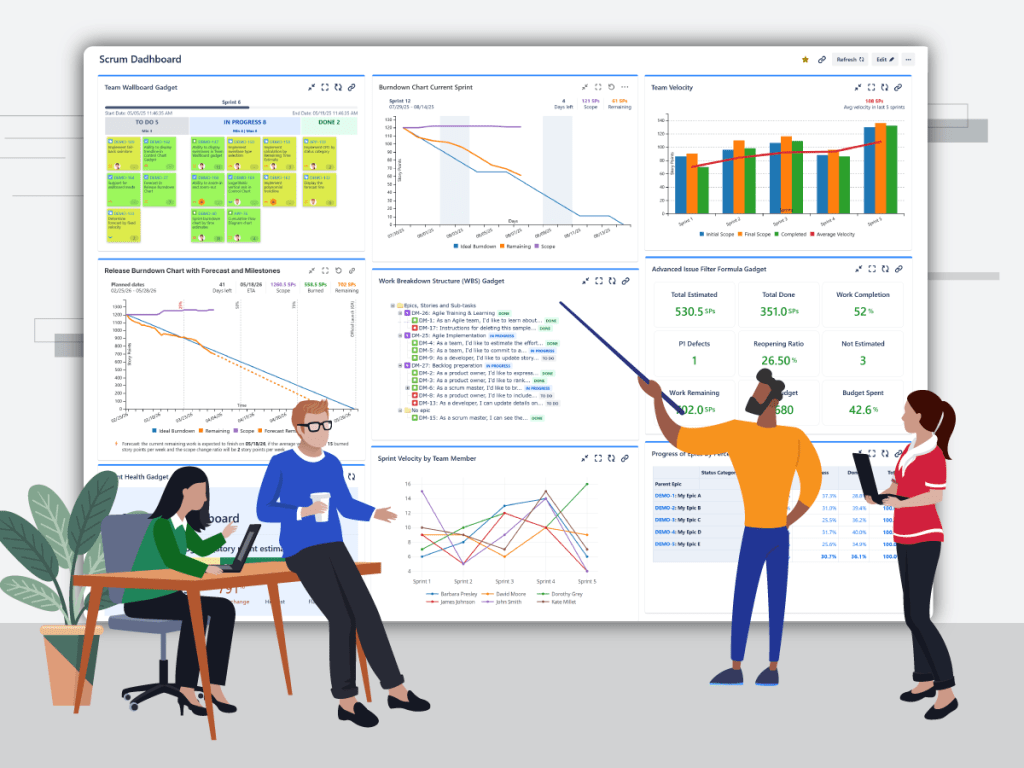 Continue reading →: 9 gadgets for a powerful Scrum dashboard in Jira
Scrum is one of the most popular agile frameworks for software development. Tracking a Scrum project in an effective way is an important task of every Scrum Master or Product Owner. Identifying and then making visible the right metrics needed not only by the team but also by management or…
-
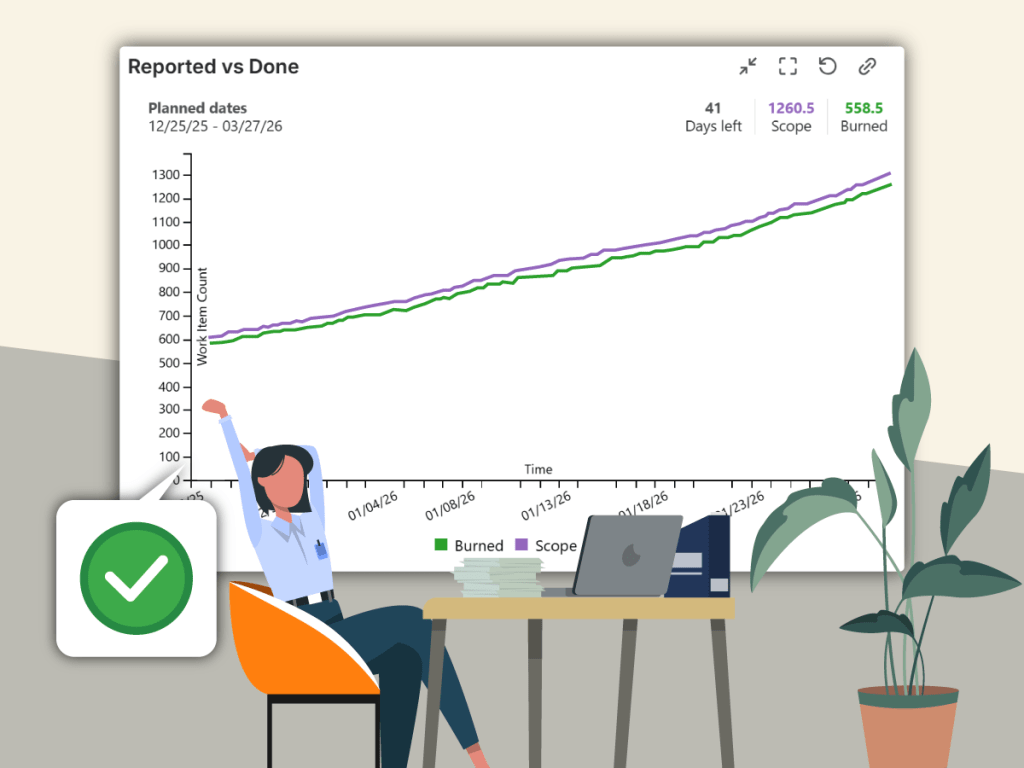 Continue reading →: A powerful Reported vs Done chart for Jira dashboards
A Reported vs Done chart tells you how your team handles the workload in time. It gives you a clear indication if your team manages to resolve work items fast enough for maintaining the backlog size in acceptable limits. Such chart is a “must have” on the monitoring dashboard of…
Follow us
Subscribe
Stay updated with our latest news by joining our newsletter.
Recent posts


Tags
agile (20) Customer Satisfaction (CSAT) (1) Customer Sentiment (1) cycle-time (1) DevOps (1) DevOps Gadgets (1) DMS (1) Documents for Jira (1) Epics (1) great-gadgets (19) IT Service Management (2) jira (8) jira-service-management (2) Jira Dashboards (1) Jira Service Management (3) kanban (3) lead-time (1) SAFe (1) scaled-agile (1) scrum (3)
Designed with WordPress
