
Pivot Tables in Jira: Real-Time Reporting for Every Team
When managing projects, having clear visibility over your data is essential. Whether you need to analyze progress, monitor team performance, or present results to stakeholders, raw issue lists and default reports often fall short.
If you’ve ever managed a project in Jira, you’ve probably exported issues to Excel more times than you care to admit.
And all this just to summarize your data and create custom calculations, aggregations, and pivot-style reporting. But what if you could bring that same flexibility and power to your Jira dashboards or even to your Confluence pages?
In this article, we’ll explain what a pivot table and a pivot chart is, why it’s useful for project management, and how you can easily create pivot tables and charts inside Jira and Confluence using the Great Gadgets app.
What is a Pivot Table?
A pivot table is simply a smarter way to look at data.
Instead of scrolling through long lists of issues, a pivot table groups, reorganizes, and summarizes them so you can answer questions like:
- How much work does each team member have?
- Where are most of our bugs coming from?
- Which initiatives consume the most effort?
- How is workload distributed across departments?
If you’ve used Excel, you already know the power of drag-and-drop grouping. Rows become columns. Counts become sums. Data reshapes itself around the question you’re asking.
That’s what a pivot table does: It reshapes your data so it tells a story.
And a Pivot Chart?
A pivot chart simply turns that summarized data into something visual: bar charts, line charts, pie charts, etc.
Because sometimes numbers are enough. And sometimes you need to see the pattern.
Why You Need Pivot Tables Inside Jira
Because teams need more than static Jira reports. They need flexible, real answers, in real time.
Jira does not offer a native pivot table, and even the Issue Statistics or Two-Dimensional Statistics gadgets have limitations.
For teams that rely on Jira for everything — engineering, marketing, design, product, operations, etc — these limitations become real blockers.
That’s exactly where Great Gadgets steps in.
Excel-Style Pivot Reporting – Without Leaving Jira
With the Pivot Table & Pivot Chart gadget offered by Great Gadgets you can have the power of Excel pivot tables right inside Jira dashboards or Confluence pages.
You choose:
- The filter (or JQL)
- The fields
- The aggregation (count, sum, average, story points, etc.)
- The table or chart type
And the table builds easily.
Live. Dynamic. Always up to date.

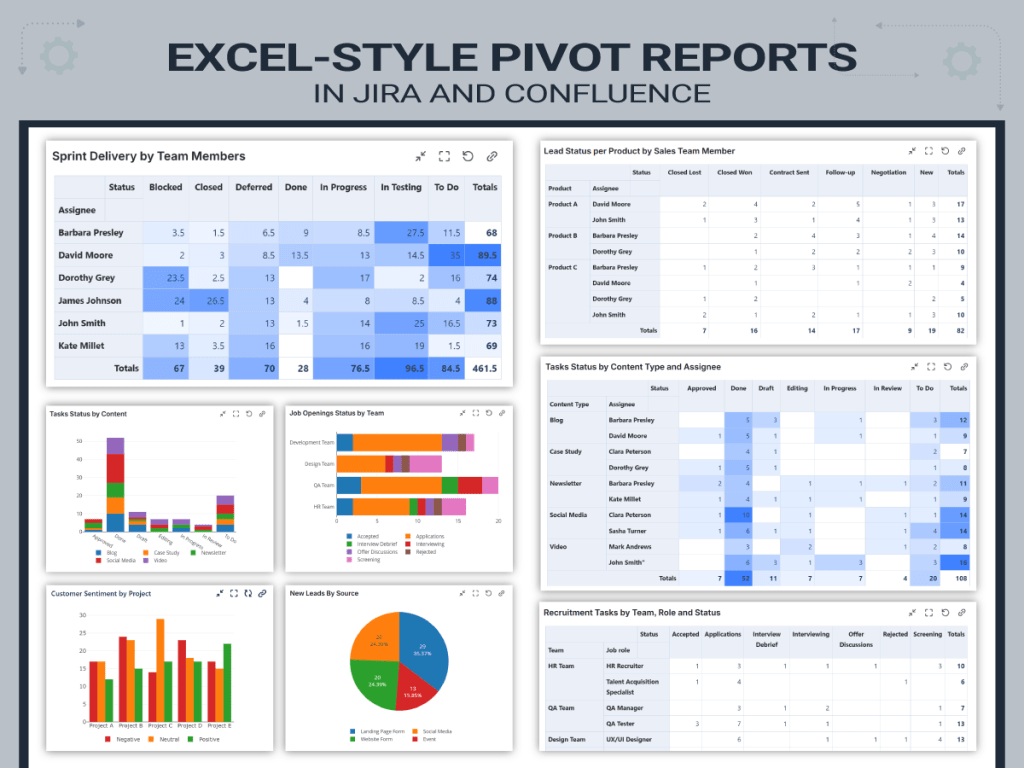
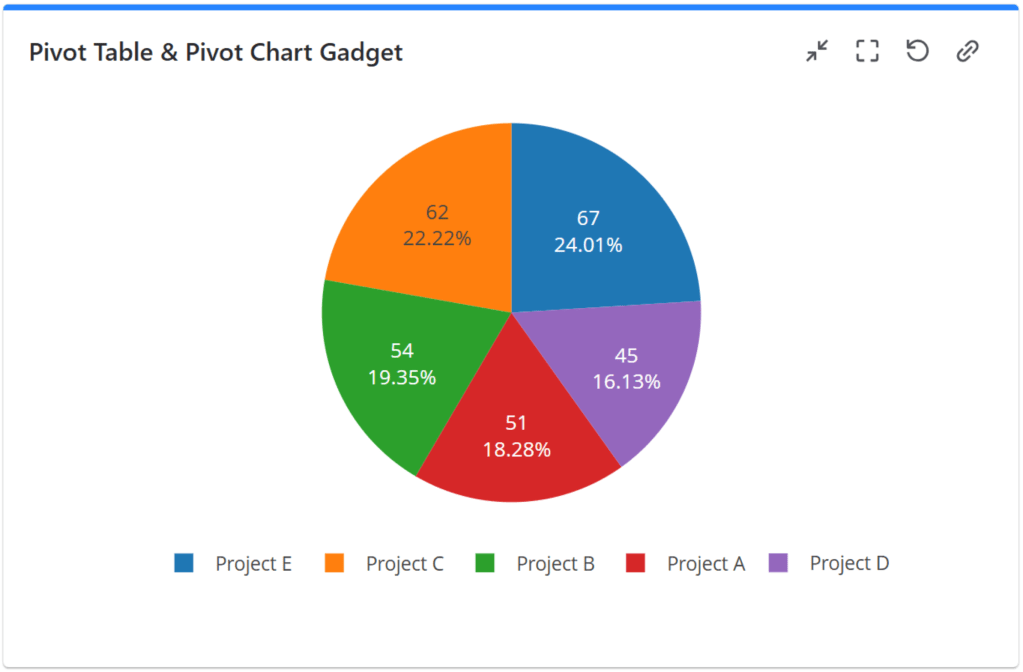
Real-life use cases with the Pivot Table & Pivot Chart gadget
You can display many different things with a pivot table, depending on what you need, but here are just a few ways development teams use this gadget to gain visibility and clarity across projects:
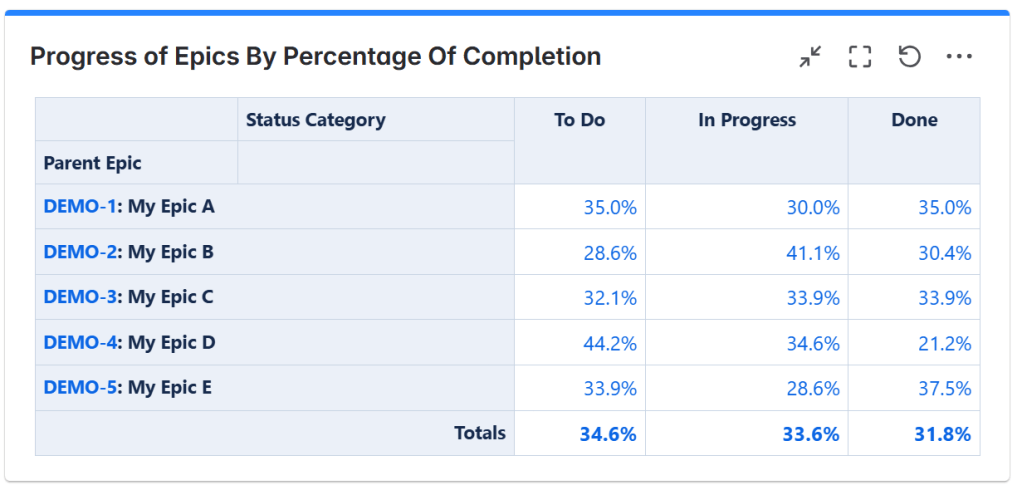
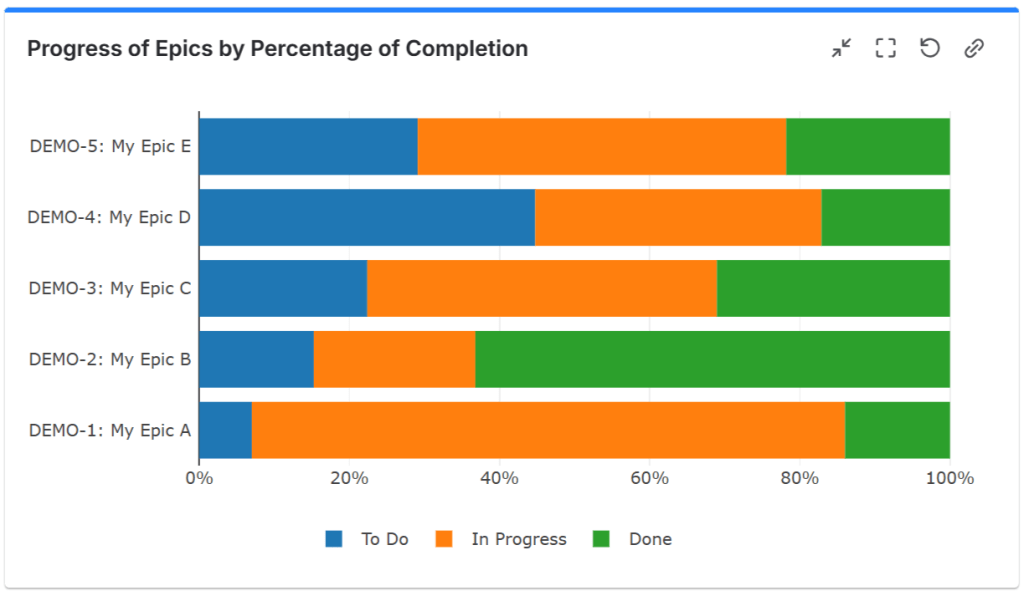
Case 1: Display progress of Epics, Initiatives and Themes
By using the Pivot Table & Pivot Chart gadget you can slice and dice your data, creating custom tables that will give a more clear view of your Epics, Initiatives or Themes. This gadget allows you to display information in form of tables, heatmap tables or charts of various types, helping you track progress in a way that makes sense for your project’s unique needs.
For more detailed information on how this can be achieved, see this article: How to display the progress of Epics, Initiatives and Themes in Jira or Confluence with Great Gadgets
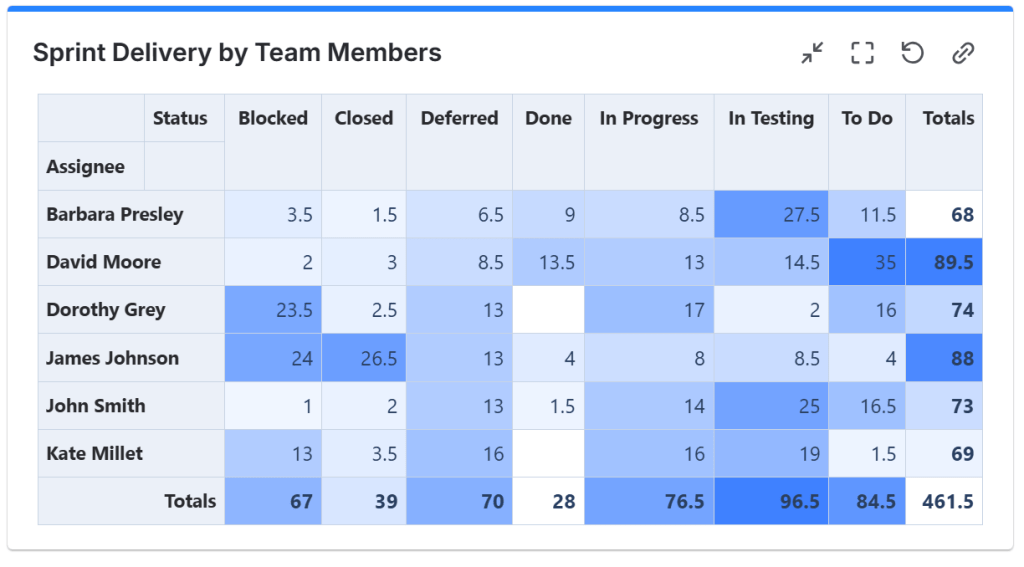
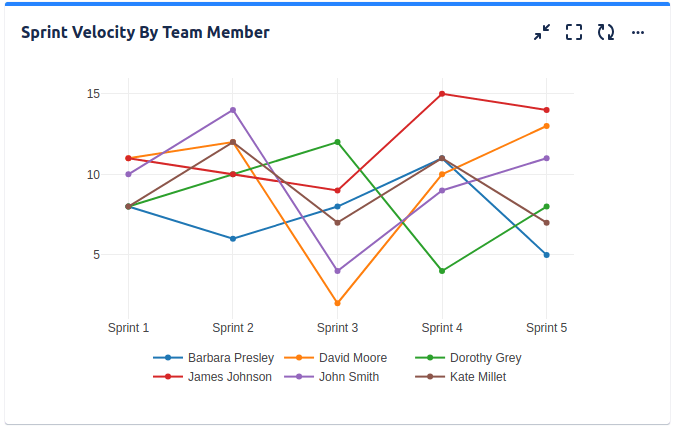
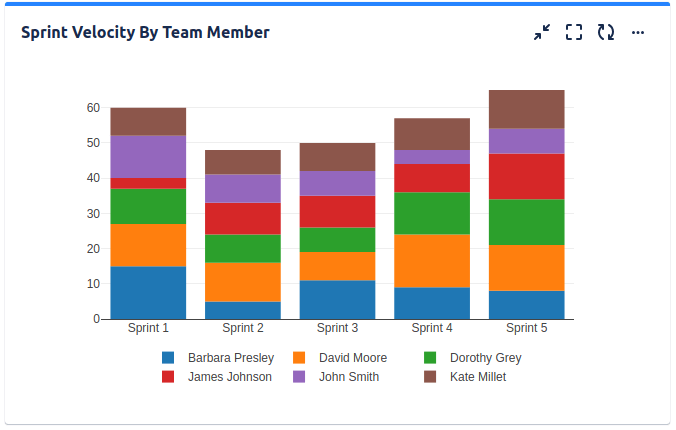
Case 2: Display Sprint Velocity by Team Member
With the Pivot Table & Pivot Chart gadget, you can create customized reports and multi-dimensional statistics that break down story points completed per team member. This will help you see how each team member is progressing through the sprint.
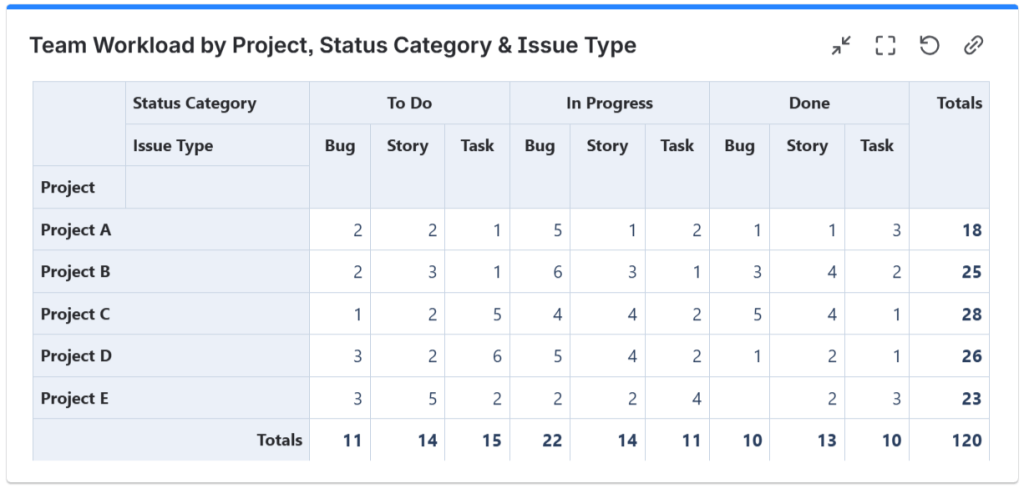
Case 3: Display Team Workload by Project, Status Category and Work Item Type
With the Pivot Table & Pivot Chart gadget, you can have a clear view of your team’s workload, understanding where attention is needed most.
These are some examples you can achieve with the Pivot Table & Pivot Chart gadget. This gadget is flexible enough to support almost any reporting scenario in Jira or Confluence — whether you’re a project manager, team lead, or executive.
Real Examples Across Non-Development Teams
One of the biggest misconceptions about reporting in Jira is that it’s only for Agile, Scrum, or Kanban teams.
Here’s the best part: pivot tables aren’t just for developers or agile methodologies. Marketing, HR, sales, support, operations or any team can slice and dice Jira data to answer the questions they really care about.
Here’s how different teams use them.
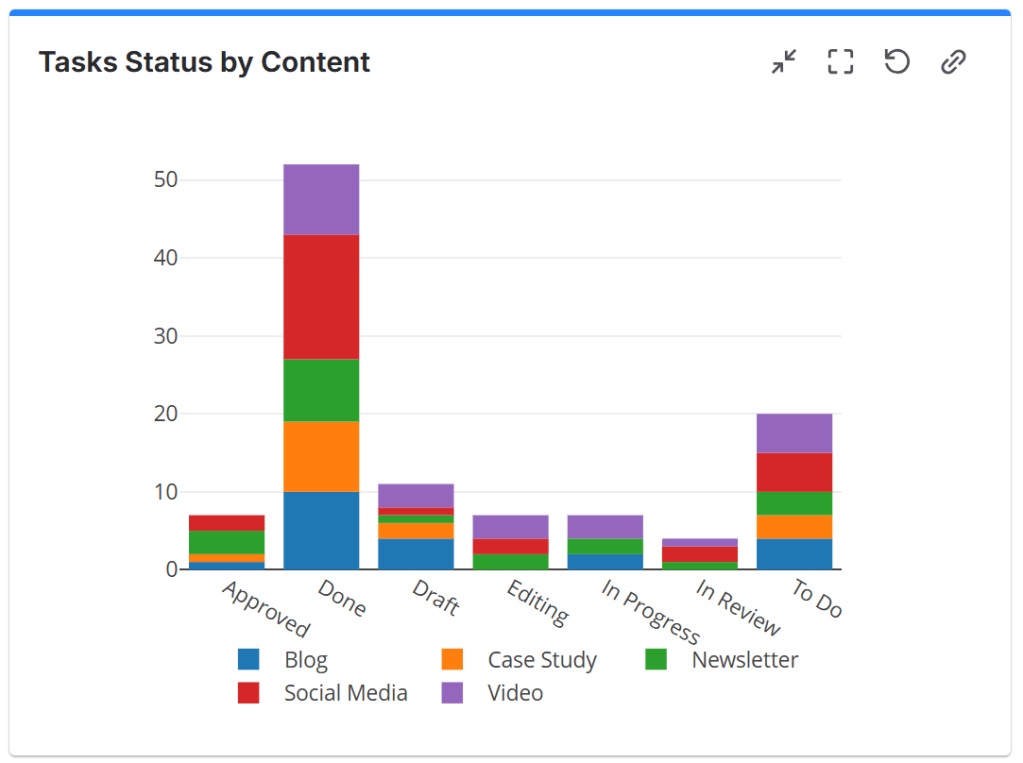
Case 4: Marketing Teams
Marketing doesn’t run on sprints. They may use pivot tables to track tasks grouped by owner and status, content items by type (blog, design, video), or requests prioritized by urgency. This helps teams balance workloads and identify bottlenecks.
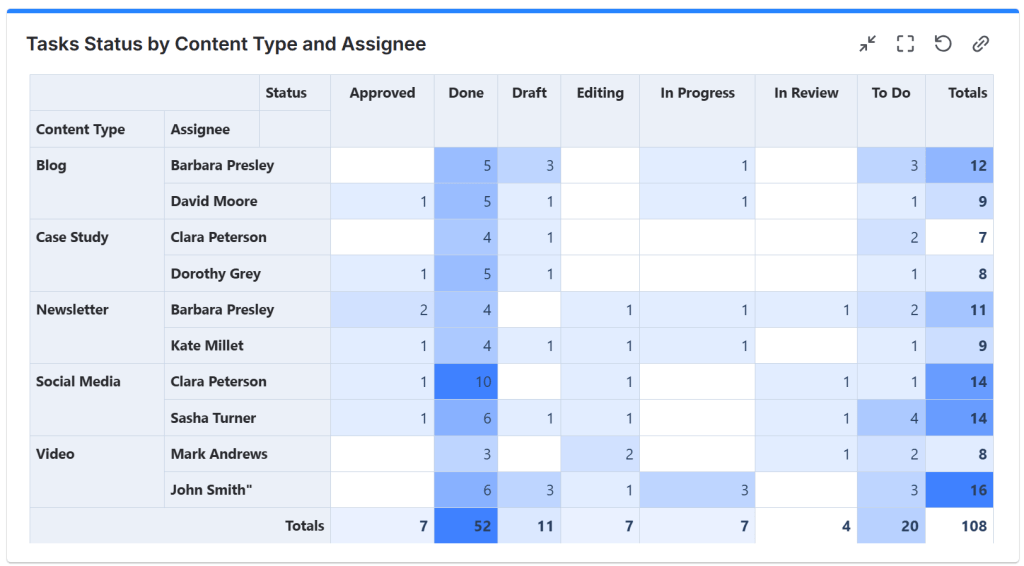
It becomes a visibility tool – not a development report.
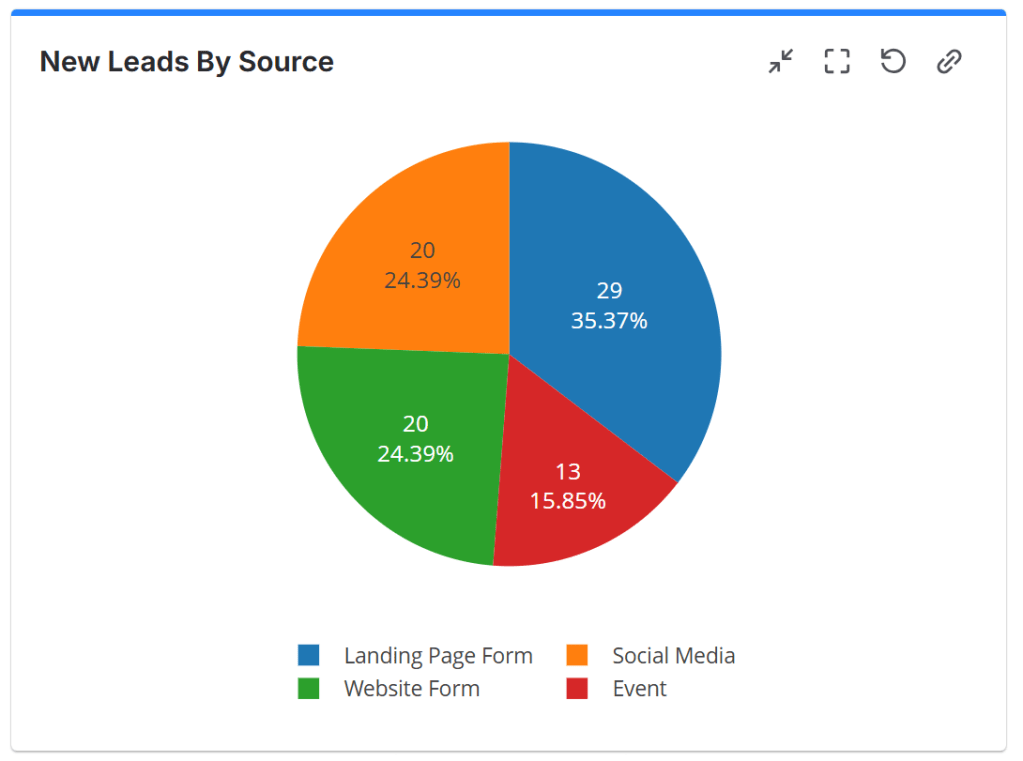
Case 5: Sales Teams
Sales teams juggle deals, opportunities, and customer interactions. Pivot tables let them: track deals by stage to spot bottlenecks, or analyze leads by sales rep to balance workloads.
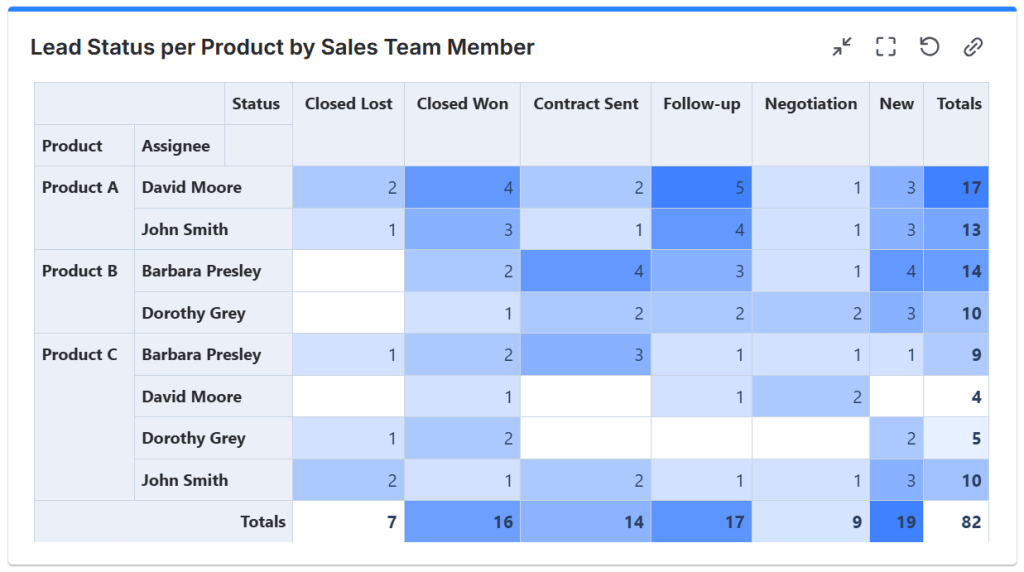
With live insights, teams know who’s overloaded, where attention is needed or they can even understand what sources bring them the most leads.
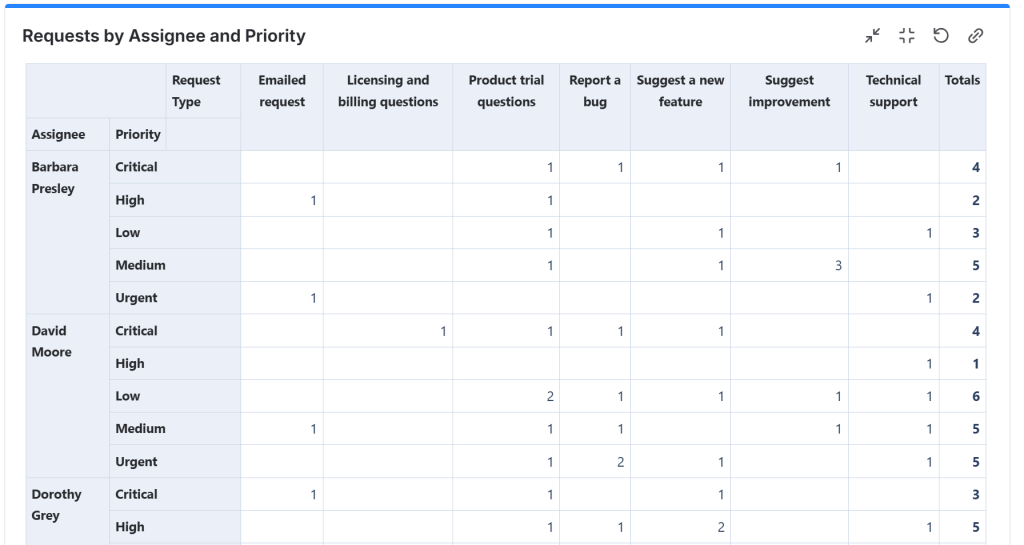
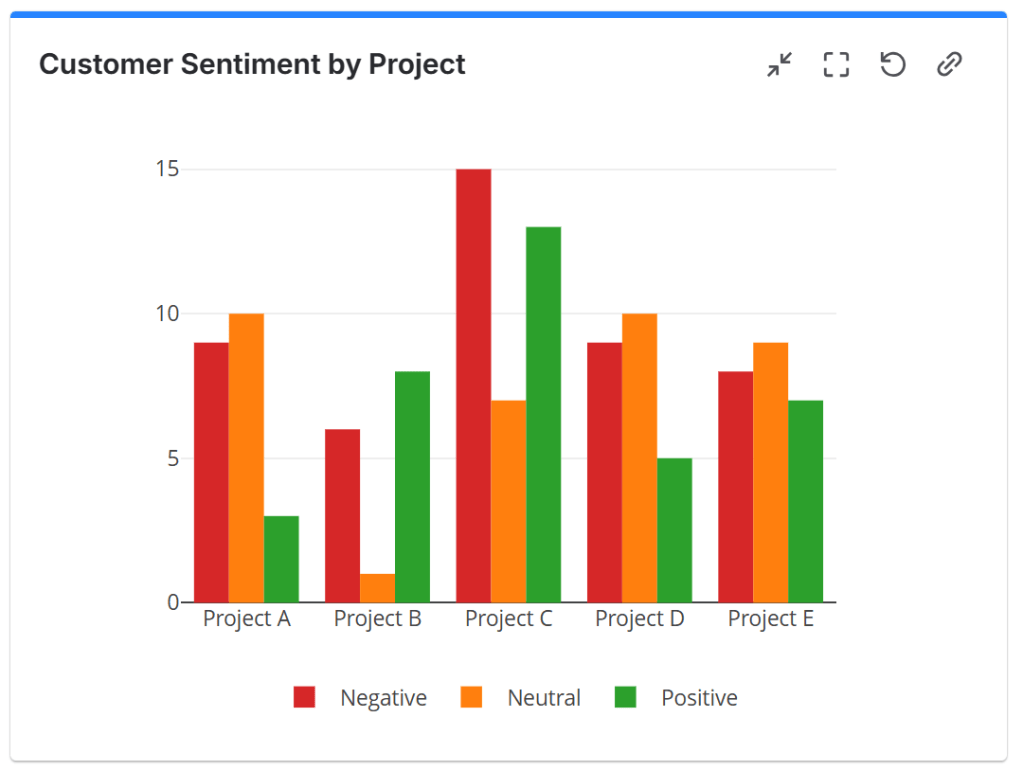
Case 6: Support Teams
Support teams can use pivot tables to monitor service performance. They may need to track tickets by status and assignee to balance workloads, analyze requests by type to identify recurring problems, group tickets by priority to focus on critical issues, monitor SLA breaches or track customer’s sentiment and feedback.
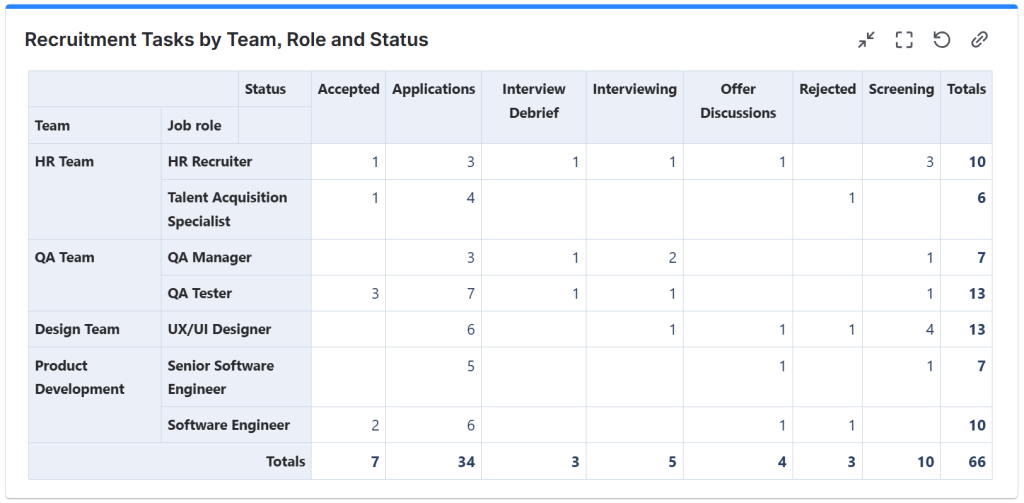
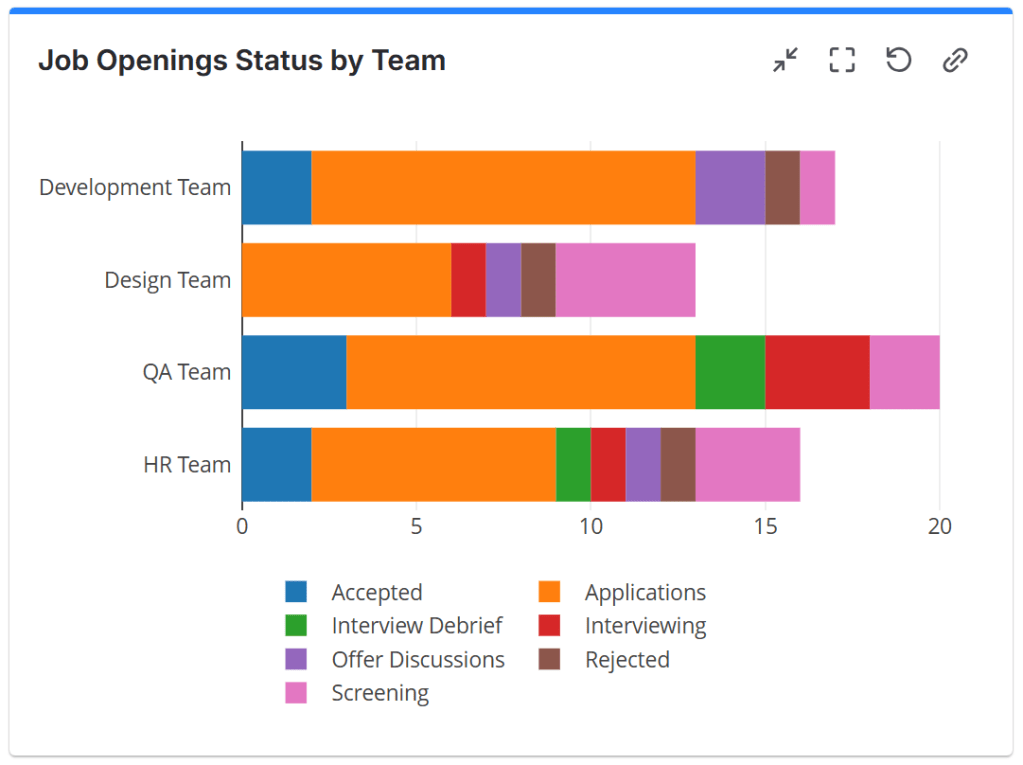
Case 7: HR Teams
Yes, HR too.
HR teams manage recruitment, onboarding, and internal requests. With pivot tables, they can count candidates by recruitment stage, view onboarding tasks by department or track HR requests by type.
All in real time. No spreadsheets. Decisions are based on current data.
Any structured data in Jira can be summarized.
Conclusion
Pivot tables aren’t “an agile feature.”
They aren’t “a dev tool.”
They aren’t “just for project managers.”
They’re a way to get better answers to your questions regardless of department, framework, or workflow.
Scrum. Kanban. Marketing. HR. Support. Leadership. It doesn’t matter. If your work is in Jira, your insights can be too.
Bring your reporting where your work already lives. When you stop exporting data just to understand it, you free up time to actually improve it.
Try the Pivot Table & Pivot Chart gadget and see how Jira data can finally work for you – without spreadsheets, without exports, without frustration.
If you’d like to test it out, Great Gadgets is free for 30 days on the Atlassian Marketplace.

Leave a comment