
Understanding how long issues spend in each workflow status is essential for any team — Agile or not.
If you’ve ever tried to track this in Jira, you’ve probably noticed one thing: native options are limited, difficult to customize, and rarely give you the real visibility you need.
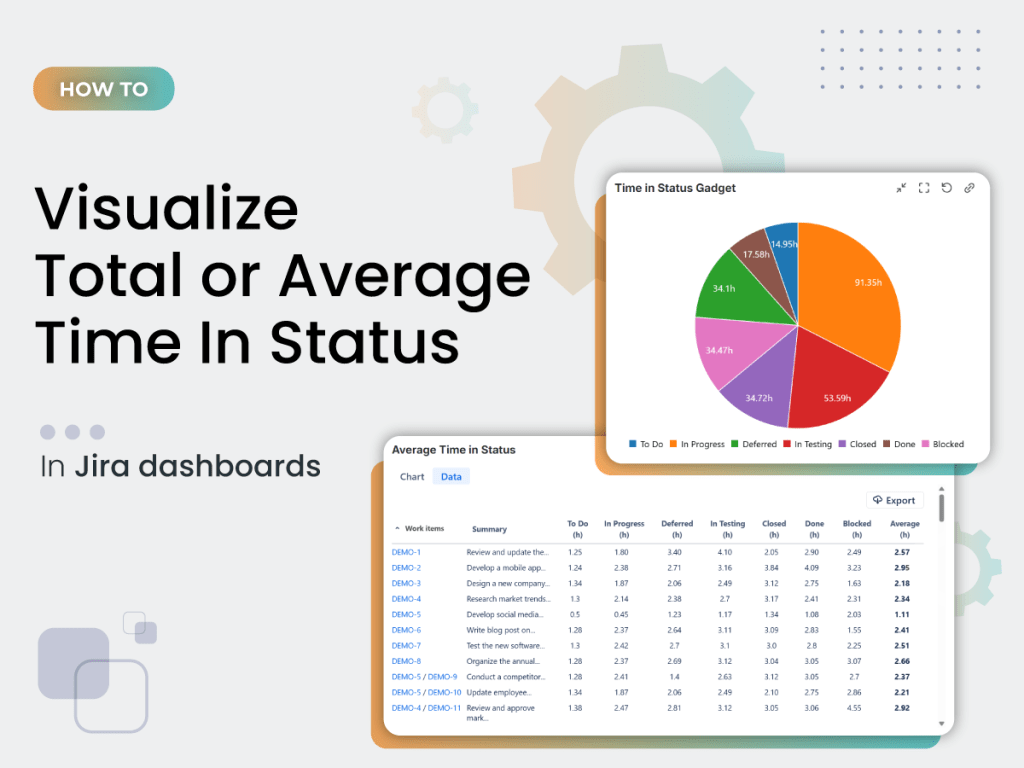
In this article you will find an easy way to see the total or the average time in status using the Time In Status gadget offered by Great Gadgets app for Jira and Confluence.
Why Jira’s Native Time In Status Tracking Falls Short
Jira includes a few built-in options to monitor time in status, but they’re limited in accuracy and flexibility:
• Average Time in Status gadget – Shows average time spent per status, but lacks custom grouping, detailed aggregation, and advanced charts.
• Days in Column on Jira boards – Displays dots on issue cards that represent days spent in a column, but it requires Jira admin rights to be enabled, shows only days, not precise hours, and can’t exclude weekends.
Because there’s no unified, accurate view, you might struggle to identify slow parts of the workflow, compare performance across teams or projects, and build dashboards that reflect real efficiency.
That’s where the Time In Status gadget from Great Gadgets comes in.
A Better Way: The Time In Status Gadget Offered by Great Gadgets
The Time In Status gadget gives you a complete, highly configurable and real-time view of how long work spends in every part of the workflow — directly on Jira dashboards.
Because we know every team operates differently, we build each gadget to be highly configurable. The Time In Status gadget provides capabilities far beyond what Jira offers out of the box:
- Tracks time in workflow statuses, status categories, or board columns
- Measures total time or average time in hours, days, or minutes
- Includes subtasks in calculations for true accuracy
- Allows selecting specific statuses or status categories to include or exclude
- Can group results by assignee, project, priority, or other custom fields
- Displays results in charts of various types: pie charts, bar charts, column or stacked column charts.
- Can display a detailed report with time for individual issues
👉 Watch the video tutorial below that walks you through setting up the Time In Status gadget and customizing it for your workflow.
Why It Matters
Time in status isn’t just a metric — it’s a foundation for continuous improvement.
With clear visibility into your workflow, teams and managers can:
- See delays early and take action before deadlines slip.
- Understand what parts of the workflow need optimization.
- Understand team performance: see who is overloaded, where work stalls, and how flow can be improved.
The Time In Status gadget adapts to any workflow and is just as useful for software teams as for marketing, HR, operations, ITSM or any kind – agile or not.
👉 If you’d like to test it out, Great Gadgets is free for 30 days on the Atlassian Marketplace.

Leave a comment