
Effective reporting is fundamental to the success of any project. Whether you’re building products with Scrum, optimizing workflows through Kanban, or coordinating delivery across multiple teams in Agile-at-Scale frameworks (such as SAFe®) having a clear, real-time view of progress is essential for achieving successful outcomes.
Engineering teams rely on reporting to understand how fast they deliver, where work gets stuck, how much scope is added mid-sprint or mid-release, how predictable they are across sprints, releases or PI increments, or whether delivery aligns with commitments and stakeholder expectations.
Without accurate, meaningful reporting it’s nearly impossible to forecast releases, measure productivity, or know whether the team is improving sprint over sprint.
Jira Offers a Solid Basic Foundation: Built-In Reports and Gadgets
Jira provides two main ways to visualize and understand your work: built-in reports and dashboard gadgets.
If you’ve used Jira for a while, you’ve probably noticed that its native reports and its dashboard gadgets are simple, reliable and easy to start with – especially for single Scrum or Kanban teams. They give you basic, quick insights into sprints, issues and team progress. But sometimes you start wondering… “Could I see subtasks? Multiple projects? A dashboard my manager actually understands?”
We’ve all been there. That’s why many teams look for solutions to generate reports that show the full picture of their work.
If your reporting needs are light, Jira’s built-in reports get the job done without extra setup.
However, when teams grow, workflows evolve or projects become more complex, the simplicity of Jira Reports might not be enough.
How Great Gadgets App Extends Jira Reporting (For Software Teams of All Sizes)
Great Gadgets is a powerful app (plugin) for Jira (and Confluence) that offers powerful, highly configurable gadgets designed for the realities of software development (but not only). It helps teams build powerful dashboards that match their real-world needs, all without exporting to Excel or using external tools.
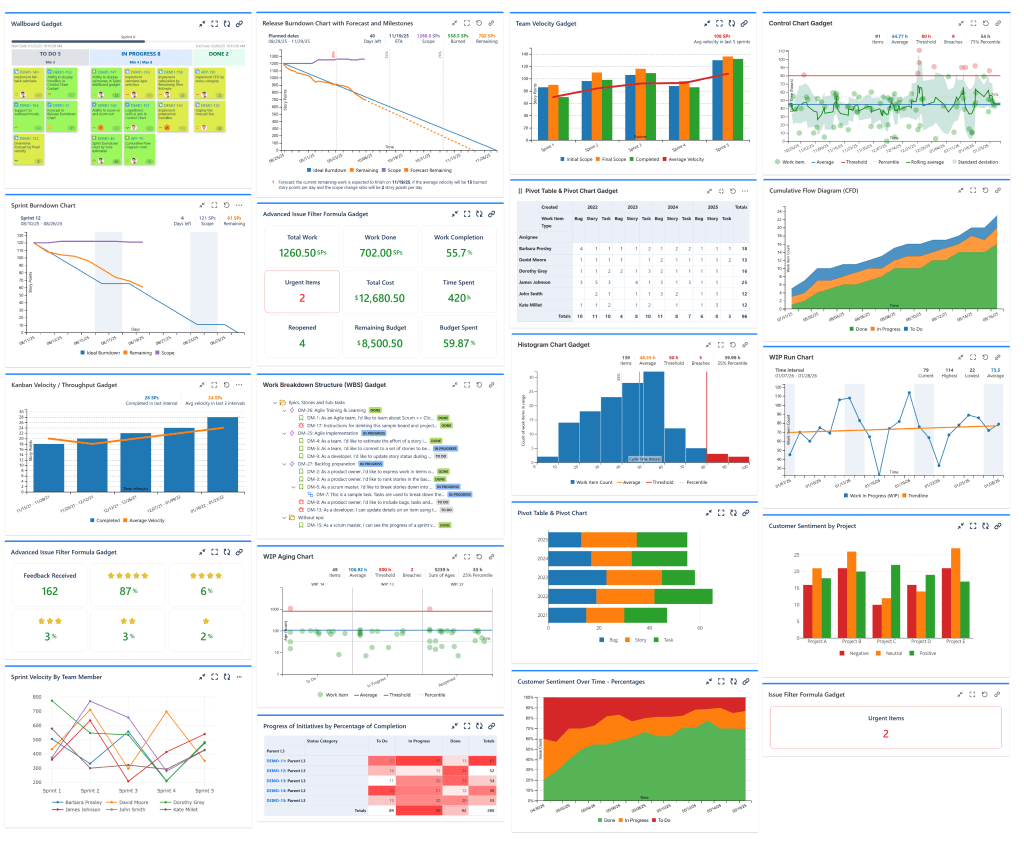
Great Gadgets helps fill in the gaps of Jira’s reporting tools with:
✔️ More Chart Types & Flexible Visuals – from burndown/burnup charts to team velocity, throughput, cycle‑time, time‑in‑status, pivot table, release & version tracking and more – all in one single app.
✔️ Cross‑Team & Cross‑Project Support – you can pull data from many projects or teams and build unified dashboards that reflect the real complexity of modern organizations.
✔️ Dashboard‑Ready Reporting – that means you don’t need to jump in and out of boards to get useful reports. Everything lives in dashboards — giving a central, unified view of status, progress, capacity and trends across your organisation.
✔️ Fully Customizable Gadgets – you can adapt charts to match exactly how your teams work.
Native Jira Reports work best when:
- ✅ You have a small team or project.
- ✅ Your workflows are straightforward and simple.
- ✅ You just want a quick view of progress or completed work.
Great Gadgets app works best when:
- ✅ You’re managing multiple teams or projects.
- ✅ You need advanced metrics like velocity, throughput, pivot tables and charts or release tracking.
- ✅ You need to customize charts to fit the way your team works.
- ✅ You want reports that tell a story, not just show numbers.
Think of Jira’s native reports as a strong foundation. Great Gadgets is the toolbox that lets you build the dashboards your teams truly need. As workflows evolve, dashboards stay maintainable — no need to rebuild everything from scratch or rely on spreadsheets or external tools.
| Jira’s reports & gadgets | Great Gadgets | |
| Issue Analysis, Displaying Project Key Numbers and Custom Metrics | ✅ Can list issues from a custom filter along with status and other fields by using Filter Results gadget ❌ Only display simple stats by issue count and percentage of total with gadgets like Two Dimensional Filter Statistic, Issue Statistics or Pie Chart gadget or report ❌ Can’t sum-up issue field ❌ Can’t calculate percentages ❌ Can’t calculate custom metrics / formulas ❌ Limited stats by a maximum of 2-fields ❌ Can’t display issues hierarchically ❌ Can’t display issues along with linked issues and their status ❌ Can’t customize colors and views, does not support GREEN / YELLOW / RED reports | ✅ Can list issues from a custom filter or JQL by using Pivot Table & Pivot Chart gadget ✅ Can calculate and display from simple (COUNT, SUM, AVERAGE) to complex math formulas combining data from up to 9 filters with Issue Filter Formula gadget or Advanced Issue Filter Formula gadget ✅ Multi-dimensional stats (by multiple fields) in form of pivot tables, heat-map tables, or charts of various types with issue counts, percentages, average, etc with Pivot Table & Pivot Chart gadget ✅ Can display issues hierarchically (Initiatives . Epics > Stories > Sub-tasks) along with their status by using WBS gadget ✅ Supports color customization, can display numbers colored by value, can display gauge charts. |
| Sprint Tracking & Reporting | ✅ Burndown Chart as project report and gadget ✅ Burnup Chart as report ✅ Sprint Health gadget ✅ Calculates by Issue Count, Story Points, Time Estimates, Custom Fields ❌ Can’t include subtasks ❌ No custom done statuses ❌ No export capabilities | ✅ Burndown Chart as gadget with Data tab ✅ Burnup Chart as gadget ✅ Sprint Report as Data tab in dashboard gadget ✅ Calculates by Issue Count, Story Points, Time Estimates, Custom Fields ✅ Can include subtasks ✅ Can configure custom done statuses ✅ Can export Data tab in CSV format |
Sprint Velocity Tracking | ✅ Velocity Chart as project report ✅ Calculates by Issue Count, Story Points, Time Estimates, Custom Fields ❌ Limited to 7 Sprints ❌ Limited sprint filtering options ❌ Can’t show active sprint ❌ Can’t include subtasks ❌ No custom done statuses ❌ No export capabilities ❌ Only basic metrics: Committed, Completed, Average | ✅ Team Velocity as gadget with Data tab ✅ Calculates by Issue Count, Story Points, Time Estimates, Custom Fields ✅ Unlimited sprints ✅ Multiple sprint filtering options ✅ Can show active sprint ✅ Can include subtasks ✅ Can configure custom done statuses ✅ Can export Data tab in CSV format ✅ Advanced metrics: Initial Scope, Final Scope, Completed, Average, Scope Change, Added, Removed, %Scope Change, %Added, %Removed, %Completed. |
| Release, Version, Epic, Initiative Tracking & Reporting | ✅ Release Burndown Chart report with forecast ✅ Version Report ✅ Epic Burndown ✅ Epic Report ❌ Limited to one project/version/epic, not cross-team or cross-project ❌ Can’t track initiatives ❌ Hard to use/understand ❌ Can’t include subtasks ❌ Can’t be customized at all | ✅ Release Burndown Burnup Chart gadget with forecast that can be used to track projects, versions, epics ✅ Cross-project, fully flexible, based on a saved filter or custom JQL ✅ Can track initiatives ✅ Easy to use/understand ✅ Can include subtasks ✅ Highly configurable. Can configure custom done statuses, forecasting options, set milestones ✅ Release, Version, Epic and Initiatives overview in form of tables, heat map tables, or charts of various types with the Pivot Table & Pivot Chart gadget |
| Control Chart, Cycle Time, Lead Time, Time in Status | ✅ Control Chart Report ✅ Cycle Time Report ✅ Resolution Time gadget ✅ Time to First Response gadget ❌ Limited to one project ❌ Limited filtering options ❌ Can’t include subtasks ❌ Can’t filter by certain statuses ❌ No Time in Status gadget or report | ✅ Allows effectively measuring cycle time, lead time, time to resolution, time-in status per total or per-issue and helps identifying trends & patters by using: Control Chart gadget, Cycle Time Trend Chart gadget, Histogram Chart gadget, Time in Status gadget ✅ Can filter by custom statuses ✅ All the gadgets offer a detailed report on their Data tab that can be exported in CSV format |
| Cumulative Flow Diagram | ✅ Cumulative Flow Diagram as a project report ❌ Limited to one project ❌ Limited filtering options ❌ Can’t include subtasks ❌ Calculates only by issue count ❌ Can’t display as percentage of total ❌ Shows stats (bands) only by issue statuses | ✅ Cumulative Flow Diagram (CFD) gadget ✅ Cross-project, fully flexible, based on a saved filter or custom JQL ✅ Calculates by issue count, story points, time estimates, custom fields ✅ Can display as percentage of total ✅ Shows stats by issue statuses, status categories, board columns, or other fields such as Priority or Issue Type |
| Agile-at-Scale, Multi-teams, Cross-Project Tracking, Enterprise | ❌ Reports limited to one team or one project; not real support for cross-team or cross-project tracking | ✅ Release Burndown Burnup Chart gadget with forecast allowing to generate cross-project, or cross-team burndown charts, tracking overall ART at the PI level when using SAFe®. ✅ Cross-team flow metrics, such as Flow Load and Flow Distribution with the Cumulative Flow Diagram gadget, Flow Velocity or Throughput with the Kanban Velocity / Throughput gadget, or Flow Time with the Histogram gadget ✅ Custom metrics and project key-numbers with the Issue Filter Formula and Advanced Issue Filter Formula gadgets ✅ High-level overview of projects, versions, epics and initiatives in form of tables, heat map tables, or charts of various types by issue count, sum of story points, time estimates or percentage of completion with the Pivot Table & Pivot Chart gadget |
The Takeaway: Native Reports = Basic Foundation. Great Gadgets = Your Extended Toolbox.
Jira native reports are for the basic level. They were built to give reliable, immediate insights — and for many teams, that’s exactly what they need.
Great Gadgets is a natural extension. A toolbox that lets you build dashboards tailored to how you work, not how the default was designed.
If you run simple projects, classic Agile workflows, or just need basic visibility — stick with what works.
If you want cross-project reporting, multi-team dashboards, custom metrics, stakeholder-friendly visuals — Great Gadgets gives you flexibility, clarity and control.
If you love Jira but wish its reports could go a little further, you don’t need to switch tools.
You just need a few extra gadgets.
👉 And if you’d like to test it out, Great Gadgets is free for 30 days on the Atlassian Marketplace.

Leave a comment