
Understanding customer sentiment is crucial for delivering exceptional service and improving user satisfaction. With the introduction of AI Sentiment Analysis in Jira Service Management (JSM), teams can now gain deeper insights into customer feedback and take proactive steps to enhance support processes.
What is Customer Sentiment Analysis in Jira Service Management?
Customer sentiment refers to the emotional tone behind a customer’s message—whether they are happy, neutral, or dissatisfied. Jira Service Management’s AI Sentiment Analysis feature helps support teams by automatically detecting and categorizing the sentiment of incoming requests using artificial intelligence. The sentiment is displayed on an issue as either Positive, Neutral, or Negative. This gives agents valuable insights into how customers are feeling so they can prioritize issues that require immediate attention, ensuring a faster, more positive resolution for frustrated customers.
Why tracking customer sentiment is important?
In a world where customer experience is a key factor for success, tracking customer sentiment is essential. Customer Sentiment Analysis not only provides a clear view of how customers perceive your products and services but also helps identify issues early, anticipate needs and make informed decisions to improve relationships. Tracking the customer sentiment over time helps you:
- Monitor service performance trends and proactively adjust customer engagement strategies
- Measure the impact of product updates or process adjustments
- Identify recurring spikes in negative sentiment, helping teams address recurring customer concerns
If you enabled AI Sentiment Analysis feature in your JSM project, you can complete your dashboards with gadgets from Great Gadgets that shows stats based on the Sentiment field of the issues.
Display real-time statistics about Customer Sentiment
By using Pivot Table & Pivot Chart gadget offered by Great Gadgets you can display the actual count or the percentage of issues based on their Sentiment field. This gadget allows you to display stats based on Sentiment in form of tables, heatmap tables or charts of various types. You can group and display customer sentiment by various fields such as project or assignee.
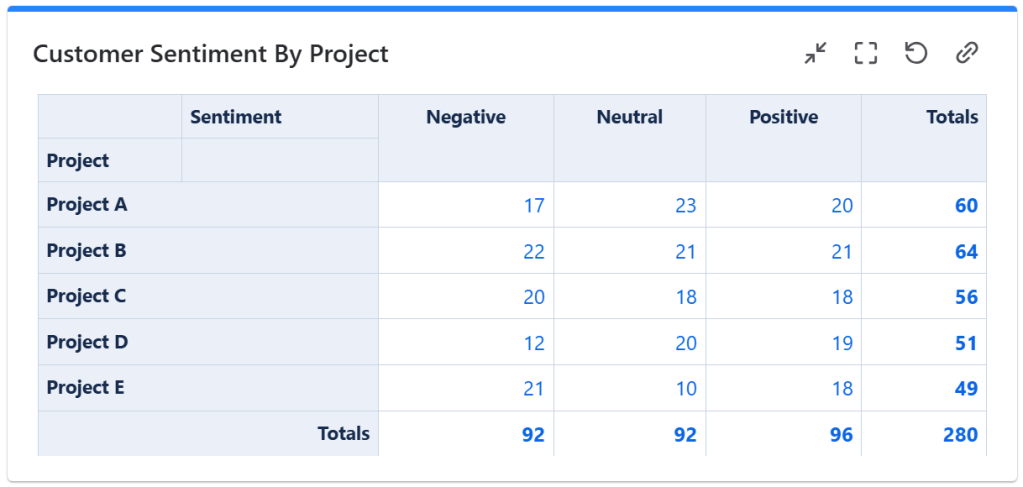
Display customer sentiment by project
One powerful way to utilize Pivot Table & Pivot Chart Gadget offered by Great Gadgets app is to track customer sentiment across different projects in Jira. This helps organizations understand which projects generate the most positive or negative feedback, allowing them to improve support processes where needed.
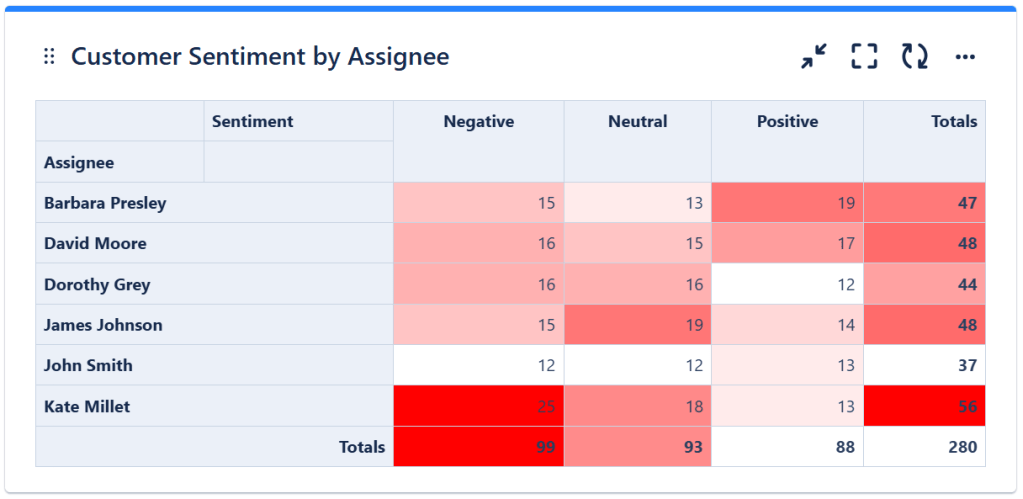
Display customer sentiment by agent
Another example of how you can use the Pivot Table & Pivot Chart Gadget offered by Great Gadgets is to track customer sentiment by agent. This will provide a clear overview of how individual team members are handling customer interactions.
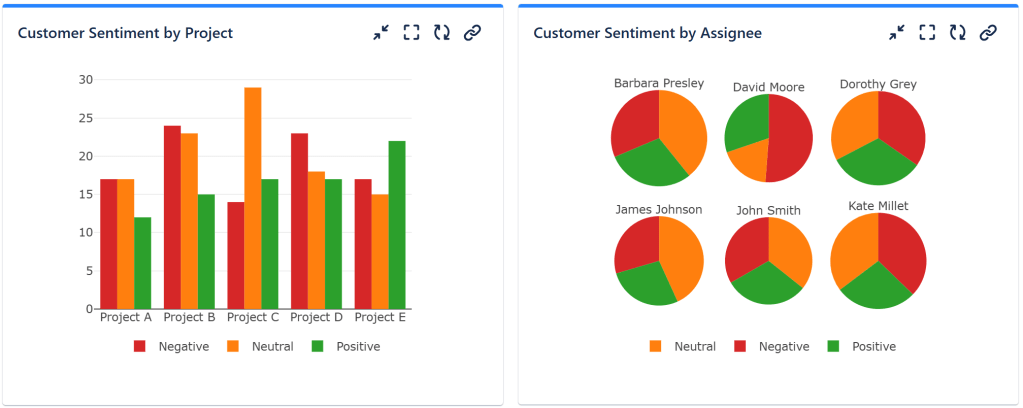
As mentioned, you can also choose to visualize the customer sentiment as various charts: column charts, line charts, bar charts, stack area charts, pie charts.

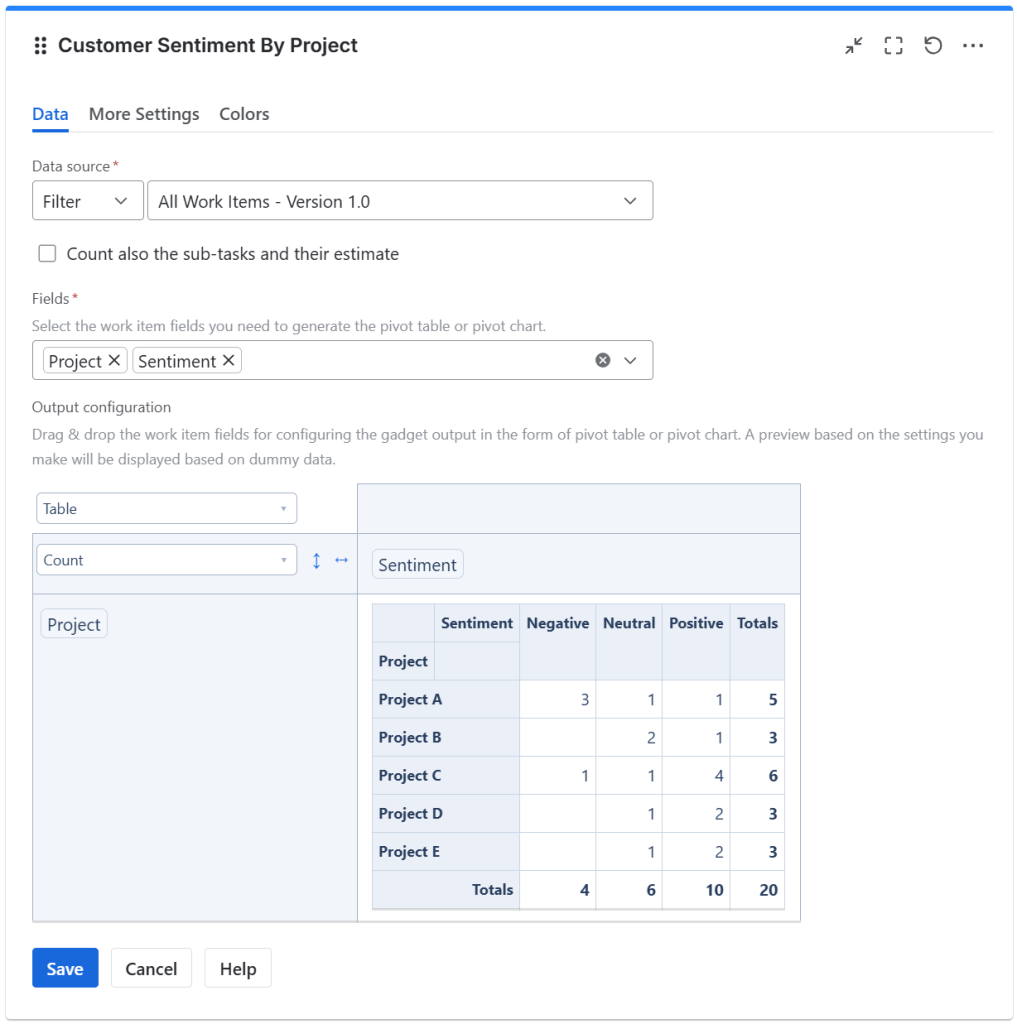
How to configure the Pivot Table and Pivot Chart Gadget to show the customer sentiment?
- Add the Pivot Table & Pivot Chart gadget to your Jira dashboard
- Enter a suggestive title
- At Data Source, select the Filter or enter the JQL that returns the issues that serve as input data for the pivot table or pivot chart. If you want the sub-tasks from the selected filter or JQL to be included, check Count also the sub-tasks and their estimate
- At Fields, select the Project and Sentiment Fields
- In the top-right cell from the Output configuration section, select Table as the type of the output data. If you want to display the results as a heatmap table where the values of interest are highlighted in shades of red, select Table Heatmap. If you want to display the results as a chart, choose the appropriate option for the type of chart you want
- By using drag & drop, place the issue fields that you want to be displayed on the columns and the rows of the table
- Click Save
Tracking customer sentiment over time
Another effective way to track customer sentiment is by using the Cumulative Flow Diagram gadget offered by the same app. Traditionally used for monitoring workflow stability, this gadget can also be configured to track the Sentiment over time.
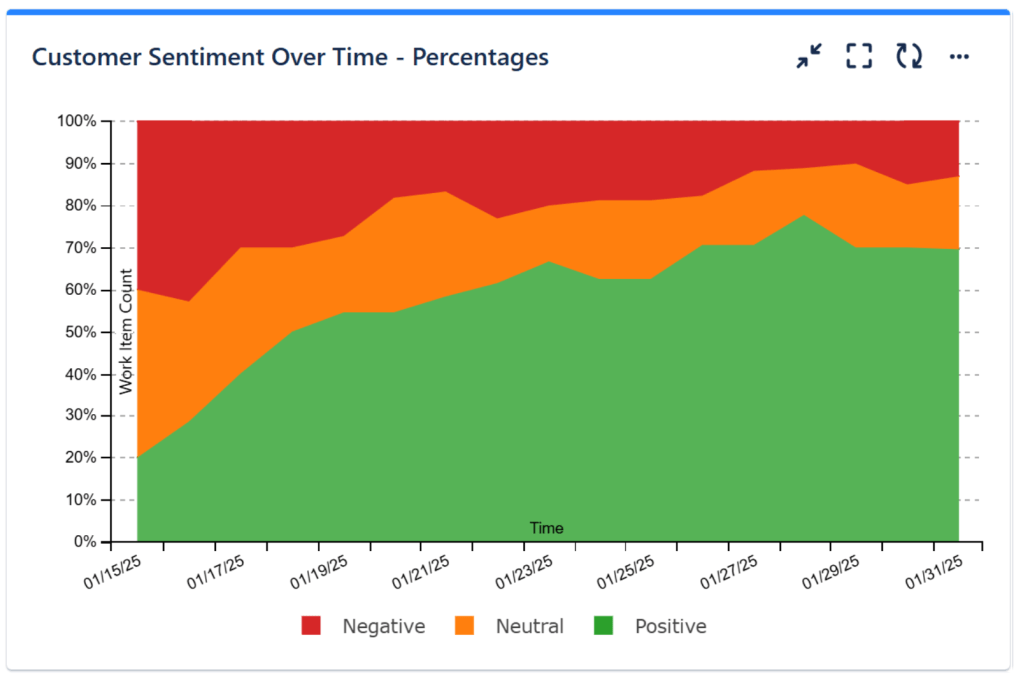
How to configure the Cumulative Flow Diagram Chart (CFD) Gadget to show the percentage of customer sentiment over time?
- Add the Cumulative Flow Diagram (CFD) gadget to your Jira dashboard.
- Enter a suggestive title
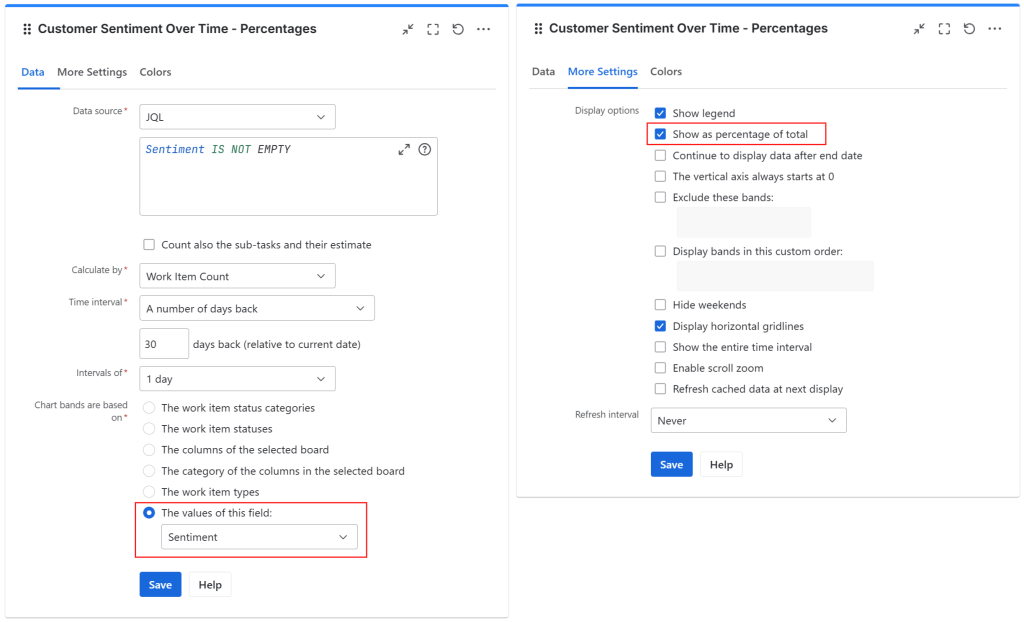
- At Data Source, enter a JQL that returns the issues with a valid Sentiment field. If you want the sub-tasks to be included, check Count also the sub-tasks and their estimate
- At Calculate by, select the gadget to calculate by Issue Count
- At Time Interval, select either a custom date, dates of a project release or, as in this example, a number of days back
- Select the Chart bands to be based on The values of this field, and select the Sentiment field from the drop-down menu
- In the More settings tab, check the Show as percentage of total option.
- In the Colors tab, you can customize the colors for the bands as you like.
- Click Save
Conclusion
The combination of Jira Service Management’s AI Sentiment Analysis and the Pivot Table & Pivot Chart and Cumulative Flow Diagram gadgets from Great Gadgets provides a powerful way to track and manage customer sentiment efficiently. Whether you’re a support team manager, an ITSM professional, or a product owner, these tools will help you proactively respond to customer needs and improve service quality.
About StonikByte
StonikByte is a Gold Marketplace Partner and the author of various apps (add-ons) for Atlassian Jira, which includes:
- Great Gadgets for Jira – a gadgets pack for tracking projects in an agile manner. Includes gadgets like sprint and release burndown / burnup charts, team velocity, issue field sum-up, cycle time, work breakdown structure (WBS) and more.
- Documents for Jira – a document management system for Jira where you can store and manage your project-related files.
- Project Team for Jira – an app that makes visible the project teams, allows extending the user profiles by adding custom fields, generates and displays org-charts.
- DevOps Gadgets for Jira – an app that brings key development insights from your Bitbucket Cloud and GitHub to your Jira dashboards. It provides essential gadgets to help teams stay on top of their DevOps processes.
To find more about StonikByte, please visit https://stonikbyte.com/.

Leave a comment