

In IT Service Management (ITSM), Average Customer Satisfaction (CSAT) is a key metric that directly impacts service improvement strategies and overall business success. It measures how satisfied customers are with the services provided, offering insights into areas needing improvement and highlighting successes. High customer satisfaction often correlates with improved customer loyalty, reduced churn, and better service outcomes. Regularly monitoring CSAT helps service teams stay aligned with customer expectations and continuously refine their service strategies.
Jira Service Management (JSM) provides a simple mechanism to collect customer feedback. When an issue is resolved, an email is automatically sent to the customer. If customer satisfaction (CSAT) surveys are enabled for your service project, this email will include a form that allows customers to leave a rating and some written feedback about how their request was handled.
Essential metrics to track
Great Gadgets app for Jira and Confluence offers some powerful gadgets that allows you to effectively measure customer satisfaction in Jira Service Management.
Assuming that customer satisfaction surveys are enabled for your service projects in JSM and you have the Great Gadgets app installed, you can start adding satisfaction-related metrics to your Jira dashboards or to the reporting pages in Confluence, as described below.
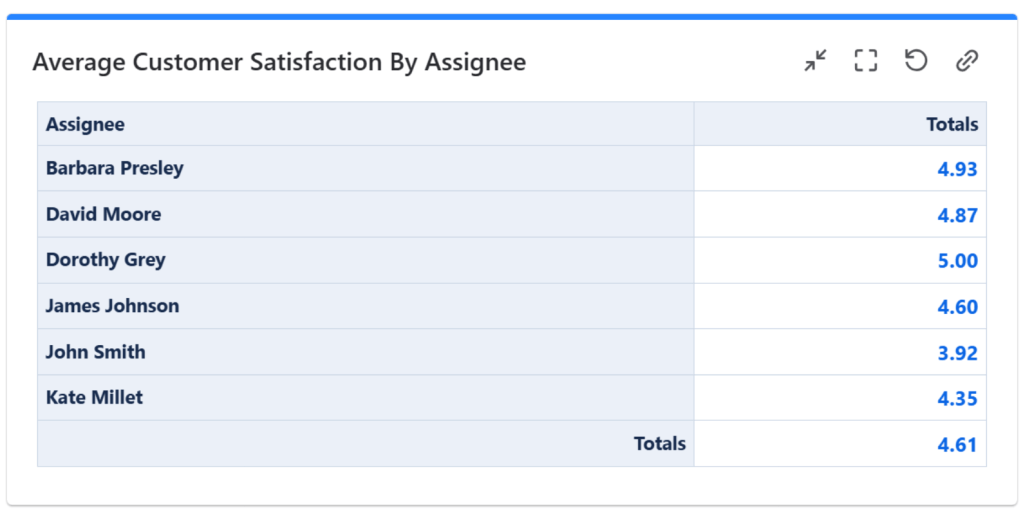
1. Average Customer Satisfaction (CSAT)
By using the Issue Filter Formula gadget offered by Great Gadgets app, you can calculate the overall or per-project average customer satisfaction score and display it in various ways: as a number, as a number colored by value, as a gauge chart, or on a 5-star scale.


Watch this video to learn more about how you can configure the Issue Filter Formula gadget to display this average customer satisfaction as well as other metrics for tracking your projects.
2. Customer Satisfaction Distribution
The Advanced Issue Filter Formula gadget offered by Great Gadgets app offers more complex calculations and additional customization options, making it ideal for detailed and nuanced customer satisfaction metrics. It can display up to 9 numbers calculated based on simple or more complex math formulas applied against the fields or a count of the issues from multiple Jira filters.
This gadget can calculate and display various metrics based on the satisfaction field. For example, you can display the customer satisfaction distribution by showing the number of issues for each satisfaction score.

Watch this video to learn more about how you can configure the Advanced Issue Filter Formula gadget to display satisfaction distribution and other project key-numbers.
3. Customer Satisfaction Score per Agent
Great Gadgets for Jira and Confluence offers an awesome Pivot Table & Pivot Chart gadget that allows you to create multidimensional statistics by various fields, including the Satisfaction field.
By using this gadget you can easily calculate and display the satisfaction score by agent / assignee, by project or any other field. The statistic can be in form of table, heat-map table or charts of various types.

Watch this video to learn more about how you can configure the Pivot Table & Pivot Chart gadget to display multi-field statistic and custom pivot charts.
4. Customer Satisfaction Trend
By using the Pivot Table & Pivot Chart gadget you can display the average customer satisfaction over time and visualize the trend. This can help you determine if your team improves the score over time or if they keep maintaining a good customer satisfaction score.


Watch this video to learn more about how you can configure the Pivot Table & Pivot Chart gadget to display multi-field statistic and custom pivot charts.
Displaying Customer Satisfaction in Confluence
Great Gadgets app can also be used in Confluence, enabling you to share your Jira insights with a broader audience. On the Data Center these gadgets can be imported as an external macro from Jira, while on the Cloud, you need to install Great Gadgets for Confluence in your Confluence Cloud instance.

Conclusion
Measuring customer satisfaction is crucial for maintaining high service standards and identifying areas for improvement. By using Great Gadgets app in Jira and Confluence, you can create powerful, customizable dashboards and pages that provide real-time insights into customer satisfaction. These gadgets help you stay on top of customer feedback and ensure your service teams deliver exceptional support.
If you have further questions or suggestions, don’t hesitate to contact support@stonikbyte.com.
About StonikByte
StonikByte is a Gold Marketplace Partner and the author of various apps (add-ons) for Atlassian Jira, which includes:
- Great Gadgets for Jira – a gadgets pack for tracking projects in an agile manner. Includes gadgets like sprint and release burndown / burnup charts, team velocity, issue field sum-up, cycle time, work breakdown structure (WBS) and more.
- Documents for Jira – a document management system for Jira where you can store and manage your project-related files.
- Project Team for Jira – an app that makes visible the project teams, allows extending the user profiles by adding custom fields, generates and displays org-charts.
- DevOps Gadgets for Jira – an app that brings key development insights from your Bitbucket Cloud and GitHub to your Jira dashboards. It provides essential gadgets to help teams stay on top of their DevOps processes.
To find more about StonikByte, please visit https://stonikbyte.com/.

Leave a comment